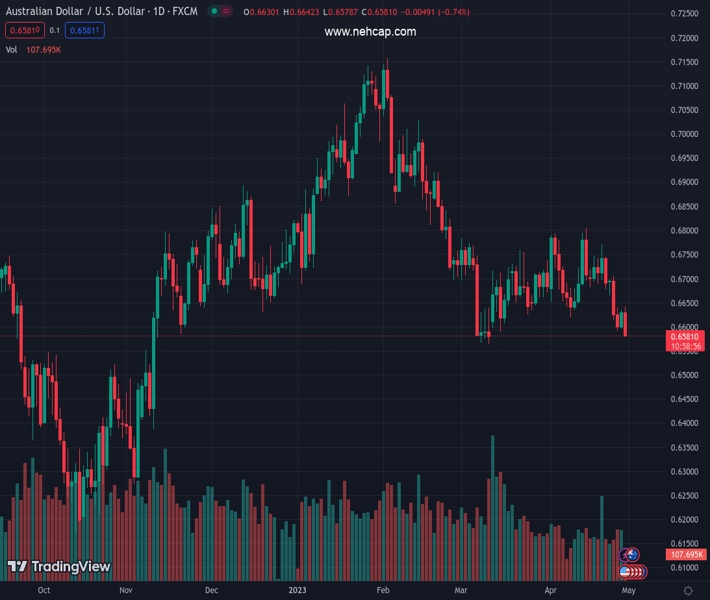
#AUDUSD @ 0.65822 comes under heavy selling pressure on Friday and drops back closer to the YTD low. (Pivot Orderbook analysis)
…
This is a premium post.
[s2If !current_user_can(access_s2member_level4)]Please register for FREE REGISTER to read full post below containing analysis. In case of any error or you think you are not able to read the full post below, please email us at support#nehcap.com [lwa][/s2If] [s2If current_user_can(access_s2member_level1)]
- AUD/USD comes under heavy selling pressure on Friday and drops back closer to the YTD low.
- A combination of factors lifts the USD to a fresh weekly high and exerts pressure on the major.
- Investors now look forward to the US Core PCE Price Index for some meaningful opportunities.
The pair currently trades last at 0.65822.
The previous day high was 0.6636 while the previous day low was 0.6595. The daily 38.2% Fib levels comes at 0.662, expected to provide resistance. Similarly, the daily 61.8% fib level is at 0.6611, expected to provide resistance.
The AUD/USD pair attracts fresh selling near the 0.6640-0.6645 area on Friday and extends its intraday descent through the first half of the European session. The downward trajectory drags spot prices to the 0.6580-0.6575 region, or the lowest level since March 10, and is sponsored by resurgent US Dollar (USD) demand.
In fact, the USD Index (DXY), which tracks the Greenback against a basket of currencies, climbs to a fresh weekly top and draws support from firming expectations for another 25 bps lift-off at the next FOMC meeting in May. The bets for additional rate hikes by the US central bank were reaffirmed by the US macro data released on Thursday, which indicated persistent inflationary pressures and that the US job market remains healthy despite an economic slowdown.
Moreover, the Bank of Japan (BoJ)-inspired sell-off in the Japanese Yen (JPY), along with a generally weaker tone surrounding the equity markets, further benefit the safe-haven buck and drive flows away from the risk-sensitive Aussie. Apart from this,
technical selling below the 0.6600 round-figure mark aggravates the bearish pressure and contributes to the AUD/USD pair’s steep intraday decline. Spot prices now move back closer to the YTD low touched in March.
Investors now look forward to the release of the US Core PCE Price Index – the Fed’s preferred inflation gauge – due later during the early North American session. Given that the markets have been pricing in a pause in the Fed’s rate-hiking cycle after May, a stronger reading might prompt aggressive short-covering around the USD and pave the way for a further depreciating move for the AUD/USD pair. Nevertheless, spot prices remain on track to register heavy weekly losses.
Technical Levels: Supports and Resistances
AUDUSD currently trading at 0.6583 at the time of writing. Pair opened at 0.663 and is trading with a change of -0.71 % .
| Overview | Overview.1 | |
|---|---|---|
| 0 | Today last price | 0.6583 |
| 1 | Today Daily Change | -0.0047 |
| 2 | Today Daily Change % | -0.7100 |
| 3 | Today daily open | 0.6630 |
The pair remains strongly bearish on the daily time frame. It trades below the 20 SMA @ 0.6694, 50 SMA 0.6703, 100 SMA @ 0.6795 and 200 SMA @ 0.6738.
| Trends | Trends.1 | |
|---|---|---|
| 0 | Daily SMA20 | 0.6694 |
| 1 | Daily SMA50 | 0.6703 |
| 2 | Daily SMA100 | 0.6795 |
| 3 | Daily SMA200 | 0.6738 |
The previous day high was 0.6636 while the previous day low was 0.6595. The daily 38.2% Fib levels comes at 0.662, expected to provide resistance. Similarly, the daily 61.8% fib level is at 0.6611, expected to provide resistance.
Note the levels of interest below:
- Pivot support is noted at 0.6605, 0.658, 0.6565
- Pivot resistance is noted at 0.6645, 0.6661, 0.6686
| Levels | Levels.1 |
|---|---|
| Previous Daily High | 0.6636 |
| Previous Daily Low | 0.6595 |
| Previous Weekly High | 0.6772 |
| Previous Weekly Low | 0.6678 |
| Previous Monthly High | 0.6784 |
| Previous Monthly Low | 0.6564 |
| Daily Fibonacci 38.2% | 0.6620 |
| Daily Fibonacci 61.8% | 0.6611 |
| Daily Pivot Point S1 | 0.6605 |
| Daily Pivot Point S2 | 0.6580 |
| Daily Pivot Point S3 | 0.6565 |
| Daily Pivot Point R1 | 0.6645 |
| Daily Pivot Point R2 | 0.6661 |
| Daily Pivot Point R3 | 0.6686 |
[/s2If]
Nehcap Expert Advisor
The NEHCAP MT4 EA is high quality professional trading system geared to generate returns without using GRID or martingales. Each trade has strict risk per trade parameter. The pairs under management include EURUSD, GBPUSD, AUDCAD, AUDNZD,GBPAUD, EURAUD, EURCAD, CHFJPY and many more.
The system is trading live: LIVE ACCOUNT TRACKING
You can run it free. Apply for a free trial and track our account. Buy the system or use profit share mechanism to generate returns on your MT4.
Join Our Telegram Group
")


