#USDJPY @ 134.229 rebounds from short-term key support confluence, struggles to extend week-start gains., @nehcap view: Further recovery expected (Pivot Orderbook analysis)
…
This is a premium post.
[s2If !current_user_can(access_s2member_level4)]Please register for FREE REGISTER to read full post below containing analysis. In case of any error or you think you are not able to read the full post below, please email us at support#nehcap.com [lwa][/s2If] [s2If current_user_can(access_s2member_level1)]
- USD/JPY rebounds from short-term key support confluence, struggles to extend week-start gains.
- 50-SMA, one-week-old ascending trend line resistances immediate downside; bulls need validation from 1.5-month-long horizontal area.
- Sluggish oscillators, key technical levels suggest Yen pair’s further grinding towards the north.
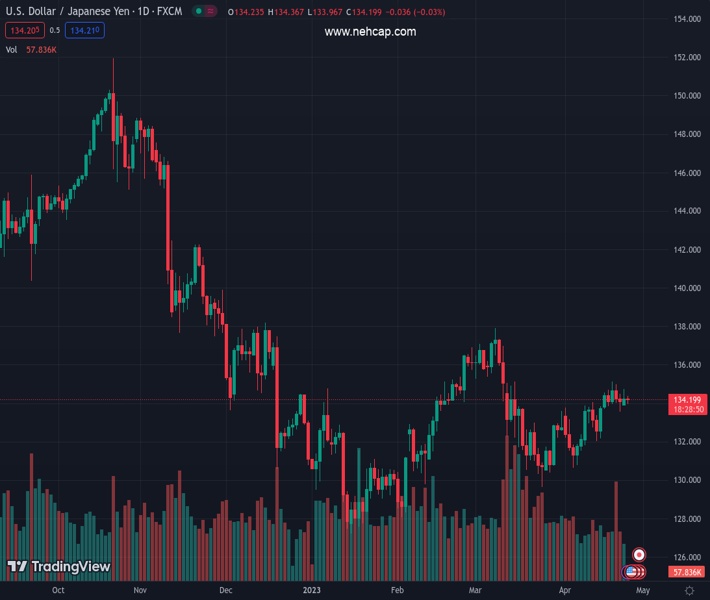
The pair currently trades last at 134.229.
The previous day high was 134.73 while the previous day low was 133.89. The daily 38.2% Fib levels comes at 134.41, expected to provide resistance. Similarly, the daily 61.8% fib level is at 134.21, expected to provide support.
USD/JPY recovers from an intraday low of 134.00, near 134.25 by the press time, as the bulls struggle to defend the week-start gains amid sluggish Tuesday morning. In doing so, the Yen pair justifies comments from the newly appointed Bank of Japan (BoJ) Governor Kazuo Ueda in the Japanese parliament.
Also read: BoJ Ueda: It is reasonable to continue easing with YCC
Apart from the BoJ Governor Ueda’s defense of the easy money policy, a convergence of the 50-SMA and a one-week-old ascending trend line, around 134.00 by the press time, also triggers the USD/JPY pair’s rebound.
Given the steady RSI (14) and the sluggish MACD, the Yen pair is likely to extend the latest rebound from the key support.
However, a horizontal area comprising multiple levels marked since March 10, close to 135.05-15, appears a tough nut to crack for the USD/JPY bulls.
Following that, 135.50 and the 136.00 round figure could test the pair buyers ahead of directing them to the previous monthly top of around 137.90.
Alternatively, pullback moves remain elusive unless the quote stays beyond the 134.00 support confluence.
Even if the USD/JPY price breaks the 134.00 support, an upward-sloping trend line from April 05, around 133.65 at the latest, can prod the bears before giving them control.
Trend: Further recovery expected
Technical Levels: Supports and Resistances
USDJPY currently trading at 134.25 at the time of writing. Pair opened at 134.23 and is trading with a change of 0.01% % .
| Overview | Overview.1 | |
|---|---|---|
| 0 | Today last price | 134.25 |
| 1 | Today Daily Change | 0.02 |
| 2 | Today Daily Change % | 0.01% |
| 3 | Today daily open | 134.23 |
The pair is trading above its 20 Daily moving average @ 133.07, above its 50 Daily moving average @ 133.78 , above its 100 Daily moving average @ 132.98 and below its 200 Daily moving average @ 137.05
| Trends | Trends.1 | |
|---|---|---|
| 0 | Daily SMA20 | 133.07 |
| 1 | Daily SMA50 | 133.78 |
| 2 | Daily SMA100 | 132.98 |
| 3 | Daily SMA200 | 137.05 |
The previous day high was 134.73 while the previous day low was 133.89. The daily 38.2% Fib levels comes at 134.41, expected to provide resistance. Similarly, the daily 61.8% fib level is at 134.21, expected to provide support.
Note the levels of interest below:
- Pivot support is noted at 133.84, 133.44, 133.0
- Pivot resistance is noted at 134.68, 135.13, 135.52
| Levels | Levels.1 |
|---|---|
| Previous Daily High | 134.73 |
| Previous Daily Low | 133.89 |
| Previous Weekly High | 135.14 |
| Previous Weekly Low | 133.55 |
| Previous Monthly High | 137.91 |
| Previous Monthly Low | 129.64 |
| Daily Fibonacci 38.2% | 134.41 |
| Daily Fibonacci 61.8% | 134.21 |
| Daily Pivot Point S1 | 133.84 |
| Daily Pivot Point S2 | 133.44 |
| Daily Pivot Point S3 | 133.00 |
| Daily Pivot Point R1 | 134.68 |
| Daily Pivot Point R2 | 135.13 |
| Daily Pivot Point R3 | 135.52 |
[/s2If]
Nehcap EA FIX downloadThe NEHCAP EA is high quality professional trading system geared to generate returns without using GRID or martingales.Each trade has strict risk per trade parameter. The pairs under management include EURUSD, GBPUSD, AUDCAD, AUDNZD,GBPAUD, EURAUD, EURCAD, CHFJPY and many more.The system is trading live: LIVE ACCOUNT TRACKING Apply for a free trial and track our account. Buy the system or use profit share mechanism to generate returns on your MT4.
Join Our Telegram Group
")


