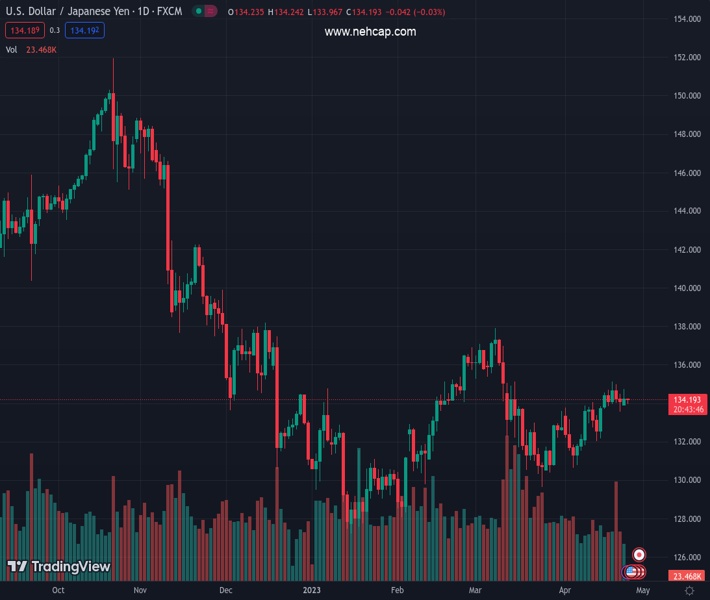
#USDJPY @ 134.168 has dropped sharply to near 134.00 after a significant sell-off in the USD Index. (Pivot Orderbook analysis)
…
This is a premium post.
[s2If !current_user_can(access_s2member_level4)]Please register for FREE REGISTER to read full post below containing analysis. In case of any error or you think you are not able to read the full post below, please email us at support#nehcap.com [lwa][/s2If] [s2If current_user_can(access_s2member_level1)]
- USD/JPY has dropped sharply to near 134.00 after a significant sell-off in the USD Index.
- Investors dumped the US Dollar in anticipation that the Fed will pause rate hikes after raising them one more time in May.
- BoJ Ueda is in no hurry of tweaking the Yield Curve Control (YCC) as inflation is expected to peak sooner.
The pair currently trades last at 134.168.
The previous day high was 134.73 while the previous day low was 133.89. The daily 38.2% Fib levels comes at 134.41, expected to provide resistance. Similarly, the daily 61.8% fib level is at 134.21, expected to provide resistance.
The USD/JPY pair has displayed a steep fall to near 134.00 in the Asian session after failing to sustain above 134.60. The asset has faced immense selling pressure amid a sell-off in the US Dollar index (DXY). The USD Index has corrected firmly to 101.26 after a breakdown of the consolidation formed in a 101.64-102.22 range.
Investors dumped the US Dollar in anticipation that the Federal Reserve (Fed) will consider a pause in the policy-tightening spree after raising interest rates one more time in May. Preliminary United States S&P Manufacturing PMI showed a recovery after landing above 50.0 for the first time in the past six months.
It is worth noting that a figure of 50.0 is considered an expansion in the scale of PMI. However, a one-time figure of recovery is insufficient to infuse optimism in investors. Therefore, the street is anticipating that the Fed will hold key rates steady after pushing rates above 5% to avoid a recession situation in the United States economy.
Meanwhile, S&P500 futures are showing nominal gains in the Asian session after a moderately positive Monday, portraying a minor recovery in the risk appetite of the market participants. The US Treasury yields have dropped further following the footprints of the USD Index. The yields on 10-year US Treasury bonds have dropped further below 3.48%.
This week, the Japanese Yen could face immense volatility amid the interest rate decision by the Bank of Japan (BoJ). A continuation of the decade-long ultra-loose monetary policy by BoJ Governor Kazuo Ueda is highly expected in order to keep inflation steadily above 2%. The BoJ has no plans for tweaking Yield Curve Control (YCC) sooner amid evidence of inflation peaking.
Technical Levels: Supports and Resistances
USDJPY currently trading at 134.09 at the time of writing. Pair opened at 134.23 and is trading with a change of -0.1 % .
| Overview | Overview.1 | |
|---|---|---|
| 0 | Today last price | 134.09 |
| 1 | Today Daily Change | -0.14 |
| 2 | Today Daily Change % | -0.10 |
| 3 | Today daily open | 134.23 |
The pair is trading above its 20 Daily moving average @ 133.07, above its 50 Daily moving average @ 133.78 , above its 100 Daily moving average @ 132.98 and below its 200 Daily moving average @ 137.05
| Trends | Trends.1 | |
|---|---|---|
| 0 | Daily SMA20 | 133.07 |
| 1 | Daily SMA50 | 133.78 |
| 2 | Daily SMA100 | 132.98 |
| 3 | Daily SMA200 | 137.05 |
The previous day high was 134.73 while the previous day low was 133.89. The daily 38.2% Fib levels comes at 134.41, expected to provide resistance. Similarly, the daily 61.8% fib level is at 134.21, expected to provide resistance.
Note the levels of interest below:
- Pivot support is noted at 133.84, 133.44, 133.0
- Pivot resistance is noted at 134.68, 135.13, 135.52
| Levels | Levels.1 |
|---|---|
| Previous Daily High | 134.73 |
| Previous Daily Low | 133.89 |
| Previous Weekly High | 135.14 |
| Previous Weekly Low | 133.55 |
| Previous Monthly High | 137.91 |
| Previous Monthly Low | 129.64 |
| Daily Fibonacci 38.2% | 134.41 |
| Daily Fibonacci 61.8% | 134.21 |
| Daily Pivot Point S1 | 133.84 |
| Daily Pivot Point S2 | 133.44 |
| Daily Pivot Point S3 | 133.00 |
| Daily Pivot Point R1 | 134.68 |
| Daily Pivot Point R2 | 135.13 |
| Daily Pivot Point R3 | 135.52 |
[/s2If]
Nehcap EA FIX downloadThe NEHCAP EA is high quality professional trading system geared to generate returns without using GRID or martingales.Each trade has strict risk per trade parameter. The pairs under management include EURUSD, GBPUSD, AUDCAD, AUDNZD,GBPAUD, EURAUD, EURCAD, CHFJPY and many more.The system is trading live: LIVE ACCOUNT TRACKING Apply for a free trial and track our account. Buy the system or use profit share mechanism to generate returns on your MT4.
Join Our Telegram Group
")


