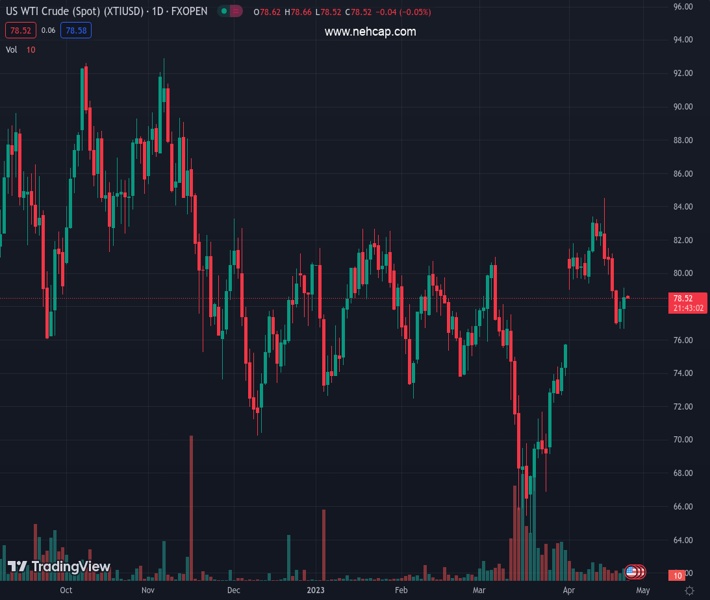
WTI struggles to extend two-day rebound from the lowest levels in three weeks. (Pivot Orderbook analysis)
…
This is a premium post.
[s2If !current_user_can(access_s2member_level4)]Please register for FREE REGISTER to read full post below containing analysis. In case of any error or you think you are not able to read the full post below, please email us at support#nehcap.com [lwa][/s2If] [s2If current_user_can(access_s2member_level1)]
- WTI struggles to extend two-day rebound from the lowest levels in three weeks.
- Demand hopes from China jostle with market’s indecision ahead of the key data/events and prod Oil buyers.
- Downbeat US Dollar, geopolitical concerns weigh on the commodity price.
The pair currently trades last at 78.59.
The previous day high was 78.34 while the previous day low was 76.69. The daily 38.2% Fib levels comes at 77.71, expected to provide support. Similarly, the daily 61.8% fib level is at 77.32, expected to provide support.
WTI crude oil retreats to $78.60 during early Tuesday, fading a two-day recovery from the early month low, as the black gold buyers seek more clues to extend the latest run-up amid a sluggish start to the key week. Even so, the demand hopes and softer US Dollar keep the commodity buyers positive.
The energy benchmark rose in the last two consecutive days as it consolidates the biggest weekly loss since early March amid expectations of higher demand from China, especially amid the upcoming May Day holidays.
Adding strength to the bullish bias could be the statements from Reuters saying, “Bookings in China for trips abroad during the upcoming May Day holiday point to a continued recovery in travel to Asian countries, but the numbers remain far off pre-COVID-19 levels with long-haul airfares soaring and not enough flights available.”
Furthermore, the US Dollar’s downbeat performance in the last three consecutive days also keeps the WTI crude oil buyers hopeful. That said, the greenback seems to bear the burden of the market’s dovish expectations from the US Federal Reserve (Fed) past the next month’s already priced-in 0.25% rate hike. “The dollar fell to a more than one-week low against major currencies on Monday in generally thin trading, as investors continued to price in interest rate cuts this year by the Federal Reserve after a widely expected rate increase at next week’s policy meeting,” said Reuters in this regard.
Elsewhere, geopolitical fears surrounding Russia, due to China’s alleged support to Moscow in fighting with Ukraine, as well as amid the Western readiness to increase sanctions on the Oil-rich nation, also allow the WTI crude oil buyers to remain hopeful.
However, a light calendar and the market’s consolidation of an upbeat week start, as well as the latest rush towards the US one-month US Treasury bonds amid fears of US default, seem to prod the Oil buyers.
Moving forward, WTI bulls are likely to remain hopeful amid an expected weakness in the US Dollar ahead of the key US Q1 GDP and Fed’s favorite inflation gauge, namely the US Core PCE Price Index.
A clear rebound from the 100-DMA support of $76.90, as well as an upside break of the one-week-old descending resistance line, now immediate support near $78.15, directs WTI crude oil buyers toward the $80.00 round figure.
Technical Levels: Supports and Resistances
XTIUSD currently trading at 78.59 at the time of writing. Pair opened at 77.92 and is trading with a change of 0.86% % .
| Overview | Overview.1 | |
|---|---|---|
| 0 | Today last price | 78.59 |
| 1 | Today Daily Change | 0.67 |
| 2 | Today Daily Change % | 0.86% |
| 3 | Today daily open | 77.92 |
The pair is trading above its 20 Daily moving average @ 78.32, above its 50 Daily moving average @ 76.41 , above its 100 Daily moving average @ 76.94 and below its 200 Daily moving average @ 82.15
| Trends | Trends.1 | |
|---|---|---|
| 0 | Daily SMA20 | 78.32 |
| 1 | Daily SMA50 | 76.41 |
| 2 | Daily SMA100 | 76.94 |
| 3 | Daily SMA200 | 82.15 |
The previous day high was 78.34 while the previous day low was 76.69. The daily 38.2% Fib levels comes at 77.71, expected to provide support. Similarly, the daily 61.8% fib level is at 77.32, expected to provide support.
Note the levels of interest below:
- Pivot support is noted at 76.96, 76.0, 75.31
- Pivot resistance is noted at 78.61, 79.3, 80.26
| Levels | Levels.1 |
|---|---|
| Previous Daily High | 78.34 |
| Previous Daily Low | 76.69 |
| Previous Weekly High | 82.61 |
| Previous Weekly Low | 76.69 |
| Previous Monthly High | 80.99 |
| Previous Monthly Low | 64.39 |
| Daily Fibonacci 38.2% | 77.71 |
| Daily Fibonacci 61.8% | 77.32 |
| Daily Pivot Point S1 | 76.96 |
| Daily Pivot Point S2 | 76.00 |
| Daily Pivot Point S3 | 75.31 |
| Daily Pivot Point R1 | 78.61 |
| Daily Pivot Point R2 | 79.30 |
| Daily Pivot Point R3 | 80.26 |
[/s2If]
Nehcap EA FIX downloadThe NEHCAP EA is high quality professional trading system geared to generate returns without using GRID or martingales.Each trade has strict risk per trade parameter. The pairs under management include EURUSD, GBPUSD, AUDCAD, AUDNZD,GBPAUD, EURAUD, EURCAD, CHFJPY and many more.The system is trading live: LIVE ACCOUNT TRACKING Apply for a free trial and track our account. Buy the system or use profit share mechanism to generate returns on your MT4.
Join Our Telegram Group
")


