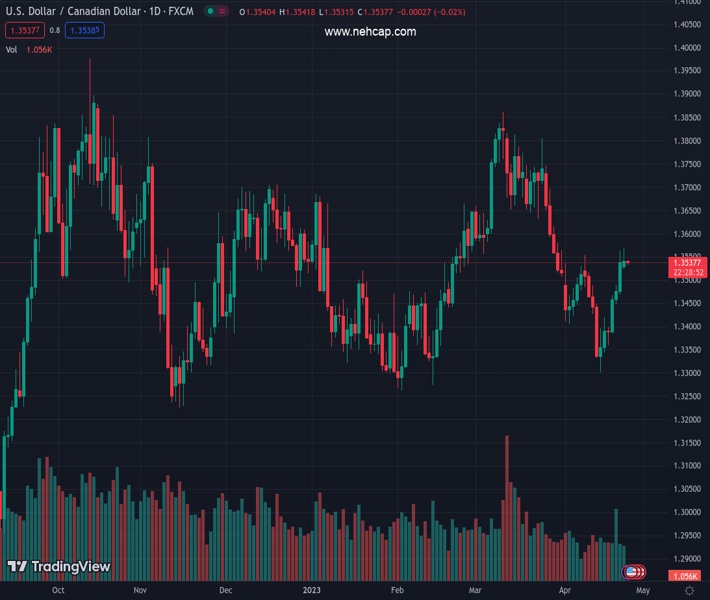
#USDCAD @ 1.35377 is demonstrating evidence of volatility contraction despite a perpendicular fall in the USD Index. (Pivot Orderbook analysis)
…
This is a premium post.
[s2If !current_user_can(access_s2member_level4)]Please register for FREE REGISTER to read full post below containing analysis. In case of any error or you think you are not able to read the full post below, please email us at support#nehcap.com [lwa][/s2If] [s2If current_user_can(access_s2member_level1)]
- USD/CAD is demonstrating evidence of volatility contraction despite a perpendicular fall in the USD Index.
- The Fed is expected to pause the policy-tightening spell after a 25bp rate hike in May.
- BoC Macklem seems not interested in raising interest rates further as inflation is consistently declining.
The pair currently trades last at 1.35377.
The previous day high was 1.3563 while the previous day low was 1.3473. The daily 38.2% Fib levels comes at 1.3529, expected to provide support. Similarly, the daily 61.8% fib level is at 1.3507, expected to provide support.
The USD/CAD pair is showing signs of volatility contraction around 1.3540 in the early Tokyo session. The Loonie asset has failed to show a power-pack action despite a breakdown move in the US Dollar Index (DXY) and a solid recovery in the oil price.
S&P500 futures ended Monday’s session on a flat-to-positive note after recovering overnight losses, indicating a cautionary approach in the overall positive market mood. Investors have decided to remain on the sidelines till the release of quarterly earnings from giant tech companies. The US Dollar Index (DXY) showed a perpendicular decline after surrendering the crucial support of 101.63.
A sell-off move in the USD Index also weighed on US Treasury yields. The demand for US government bonds rebounded as rising odds of only one more rate hike left by the Federal Reserve (Fed) eased cautious market sentiment. The yields offered on 10-year US Treasury bonds dropped below 3.50%.
Analysts at Wells Fargo see the Federal Open Market Committee (FOMC) raising rates by 25 basis points, on what they believe will most likely be the last rate hike in this tightening cycle. They point out that incoming data indicate that inflationary pressures remain acute. They further added, “We do not think the statement will fully close the door on further rate hikes, given that inflation remains well above target. Rather, the statement likely will include an acknowledgment that further adjustments in rates are possible.
Meanwhile, the Canadian Dollar is facing immense pressure as Bank of Canada (BoC) Governor Tiff Macklem seems not interested in raising interest rates further as inflationary pressures are consistently declining. However, BoC Governor has left room open for more rates if inflation continues to remain persistent.
On the oil front, oil prices showed a decent recovery backed by a sell-off in the USD Index and growing optimism that China’s May Day holiday will increase travel and fuel demand. It is worth noting that Canada is the leading exporter of oil to the United States and higher oil prices will support the Canadian Dollar.
Technical Levels: Supports and Resistances
USDCAD currently trading at 1.3539 at the time of writing. Pair opened at 1.354 and is trading with a change of -0.01 % .
| Overview | Overview.1 | |
|---|---|---|
| 0 | Today last price | 1.3539 |
| 1 | Today Daily Change | -0.0001 |
| 2 | Today Daily Change % | -0.0100 |
| 3 | Today daily open | 1.3540 |
The pair is trading above its 20 Daily moving average @ 1.348, below its 50 Daily moving average @ 1.3566 , above its 100 Daily moving average @ 1.3529 and above its 200 Daily moving average @ 1.3412
| Trends | Trends.1 | |
|---|---|---|
| 0 | Daily SMA20 | 1.3480 |
| 1 | Daily SMA50 | 1.3566 |
| 2 | Daily SMA100 | 1.3529 |
| 3 | Daily SMA200 | 1.3412 |
The previous day high was 1.3563 while the previous day low was 1.3473. The daily 38.2% Fib levels comes at 1.3529, expected to provide support. Similarly, the daily 61.8% fib level is at 1.3507, expected to provide support.
Note the levels of interest below:
- Pivot support is noted at 1.3487, 1.3435, 1.3397
- Pivot resistance is noted at 1.3578, 1.3616, 1.3668
| Levels | Levels.1 |
|---|---|
| Previous Daily High | 1.3563 |
| Previous Daily Low | 1.3473 |
| Previous Weekly High | 1.3563 |
| Previous Weekly Low | 1.3343 |
| Previous Monthly High | 1.3862 |
| Previous Monthly Low | 1.3508 |
| Daily Fibonacci 38.2% | 1.3529 |
| Daily Fibonacci 61.8% | 1.3507 |
| Daily Pivot Point S1 | 1.3487 |
| Daily Pivot Point S2 | 1.3435 |
| Daily Pivot Point S3 | 1.3397 |
| Daily Pivot Point R1 | 1.3578 |
| Daily Pivot Point R2 | 1.3616 |
| Daily Pivot Point R3 | 1.3668 |
[/s2If]
Nehcap EA FIX downloadThe NEHCAP EA is high quality professional trading system geared to generate returns without using GRID or martingales.Each trade has strict risk per trade parameter. The pairs under management include EURUSD, GBPUSD, AUDCAD, AUDNZD,GBPAUD, EURAUD, EURCAD, CHFJPY and many more.The system is trading live: LIVE ACCOUNT TRACKING Apply for a free trial and track our account. Buy the system or use profit share mechanism to generate returns on your MT4.
Join Our Telegram Group
")


