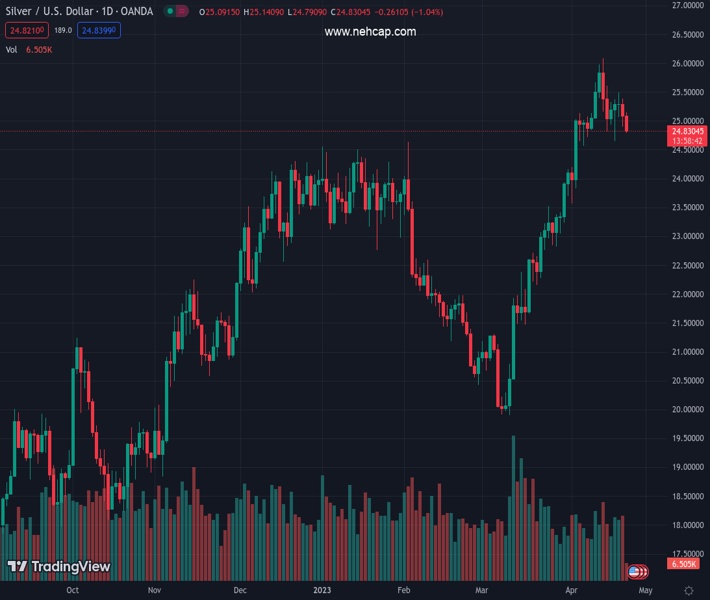
#XAGUSD @ 24.844 Silver drifts lower for the second straight day, though defends 100-period SMA on the 4-hour chart. (Pivot Orderbook analysis)
…
This is a premium post.
[s2If !current_user_can(access_s2member_level4)]Please register for PREMIUM VERSION HERE to read full post below containing analysis. In case of any error or you think you are not able to read the full post below, please email us at support#nehcap.com [lwa][/s2If] [s2If current_user_can(access_s2member_level4)]
- Silver drifts lower for the second straight day, though defends 100-period SMA on the 4-hour chart.
- The mixed oscillators on hourly/daily charts warrant some caution before placing aggressive bets.
- A sustained weakness below the $24.40-30 area is needed to support prospects for deeper losses.
The pair currently trades last at 24.844.
The previous day high was 25.39 while the previous day low was 24.9. The daily 38.2% Fib levels comes at 25.09, expected to provide resistance. Similarly, the daily 61.8% fib level is at 25.2, expected to provide resistance.
Silver remains under some selling pressure for the second successive day on Monday and drops to a three-day low, around the $24.80-$24.75 region heading into the European session.
From a technical perspective, the XAG/USD, so far, has managed to defend the 100-period Simple Moving Average (SMA) on the 4-hour chart. This is closely followed by the 23.6% Fibonacci retracement level of the March-April rally, around the $24.65 zone and the $24.40-$24.30 strong horizontal resistance breakpoint, now turned support.
With oscillators on hourly charts holding deep in the negative territory, a convincing break below the latter will set the stage for an extension of the recent pullback from a yearly peak, around the $26.10 region touched on April 14. The XAG/USD might then weaken further below the $24.00 mark and test the 38.2% Fibo. level, around the $23.70 area.
On the flip side, any intraday positive move back above the $25.00 psychological mark now seems to confront some resistance near the $25.20 horizontal level ahead of the $25.50-$25.60 supply zone. A sustained strength beyond will negate the negative bias and allow the XAG/USD to make a fresh attempt to conquer the $26.00 round-figure mark.
Some follow-through buying will mark a fresh bullish breakout and set the stage for a further near-term appreciating move. The next relevant hurdle is pegged near the $26.25-$26.30 region, above which the XAG/USD could aim to reclaim the $27.00 round-figure mark.
Technical Levels: Supports and Resistances
XAGUSD currently trading at 24.88 at the time of writing. Pair opened at 25.1 and is trading with a change of -0.88 % .
| Overview | Overview.1 | |
|---|---|---|
| 0 | Today last price | 24.88 |
| 1 | Today Daily Change | -0.22 |
| 2 | Today Daily Change % | -0.88 |
| 3 | Today daily open | 25.10 |
The pair remains strongly bullish on the daily timeframe. It trades above its 20 SMA @ 24.62, 50 SMA 22.75, 100 SMA @ 23.1 and 200 SMA @ 21.41.
| Trends | Trends.1 | |
|---|---|---|
| 0 | Daily SMA20 | 24.62 |
| 1 | Daily SMA50 | 22.75 |
| 2 | Daily SMA100 | 23.10 |
| 3 | Daily SMA200 | 21.41 |
The previous day high was 25.39 while the previous day low was 24.9. The daily 38.2% Fib levels comes at 25.09, expected to provide resistance. Similarly, the daily 61.8% fib level is at 25.2, expected to provide resistance.
Note the levels of interest below:
- Pivot support is noted at 24.87, 24.65, 24.39
- Pivot resistance is noted at 25.36, 25.62, 25.85
| Levels | Levels.1 |
|---|---|
| Previous Daily High | 25.39 |
| Previous Daily Low | 24.90 |
| Previous Weekly High | 25.60 |
| Previous Weekly Low | 24.64 |
| Previous Monthly High | 24.16 |
| Previous Monthly Low | 19.90 |
| Daily Fibonacci 38.2% | 25.09 |
| Daily Fibonacci 61.8% | 25.20 |
| Daily Pivot Point S1 | 24.87 |
| Daily Pivot Point S2 | 24.65 |
| Daily Pivot Point S3 | 24.39 |
| Daily Pivot Point R1 | 25.36 |
| Daily Pivot Point R2 | 25.62 |
| Daily Pivot Point R3 | 25.85 |
[/s2If]
Join Our Telegram Group
")


