#USDCAD @ 1.35517 A combination of supporting factors pushes back closer to the monthly peak. (Pivot Orderbook analysis)
…
This is a premium post.
[s2If !current_user_can(access_s2member_level4)]Please register for PREMIUM VERSION HERE to read full post below containing analysis. In case of any error or you think you are not able to read the full post below, please email us at support#nehcap.com [lwa][/s2If] [s2If current_user_can(access_s2member_level4)]
- A combination of supporting factors pushes USD/CAD back closer to the monthly peak.
- Bearish Oil prices undermine the Loonie and act as a tailwind amid fresh USD buying.
- Bets for more Fed rate hikes and a weaker risk tone benefit the safe-haven Greenback.
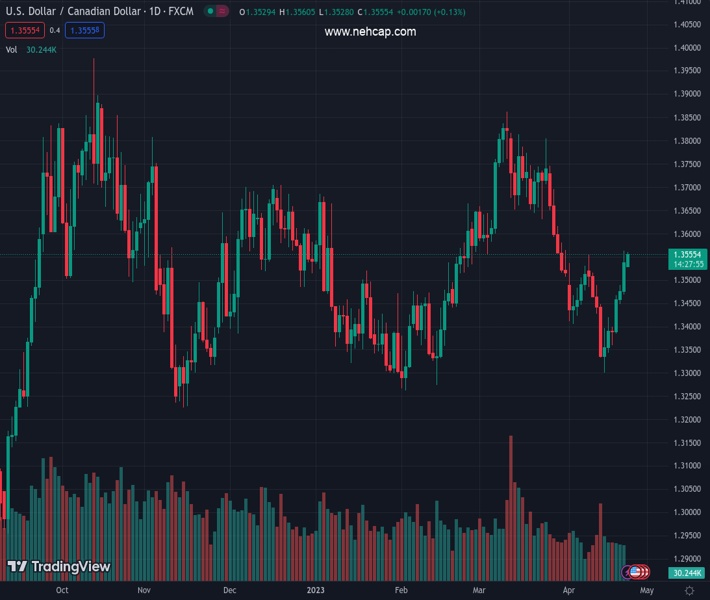
The pair currently trades last at 1.35517.
The previous day high was 1.3563 while the previous day low was 1.3473. The daily 38.2% Fib levels comes at 1.3529, expected to provide support. Similarly, the daily 61.8% fib level is at 1.3507, expected to provide support.
The USD/CAD pair kicks off the new week on a positive note and steadily climbs back closer to the monthly peak touched on Friday. The pair currently trades just above the mid-1.3500s, up nearly 0.15% for the day and draws support from a combination of factors.
Despite the prospect of tighter supplies on OPEC+ supply cuts, Crude Oil prices languish near the monthly low amid concerns that rising borrowing costs will hamper global economic growth and dent fuel demand. This, in turn, is seen undermining the commodity-linked Loonie. Apart from this, a modest US Dollar (USD) uptick assists the USD/CAD pair to capitalize on its recent strong recovery from the 1.3300 mark, or a two-month low.
The USD regains some positive traction in the wake of growing acceptance that the Federal Reserve (Fed) will continue raising interest rates to curb inflation. In fact, a 25 bps lift-off at the next FOMC meeting in May is fully priced in the markets and the Fed funds future indicates a small chance of another rate hike in June. The bets were lifted by the recent hawkish comments by several Fed officials and the incoming positive US macro data.
The flash version of S&P Global’s PMI survey showed on Friday that the overall business activity in the US private sector expanded at a faster pace in April. The activity in the service sector grew for a third straight month and at the fastest rate in a year, while the gauge for the US manufacturing sector moved into the expansion territory for the first time since October 2022, suggesting that the world’s largest economy remained resilient.
Apart from this, a generally weaker tone around the equity markets further benefits the Greenback’s relative safe-haven status and acts as a tailwind for the USD/CAD pair. In the absence of any relevant economic data from the US, the aforementioned fundamental backdrop favours bullish traders and supports prospects for a further near-term appreciating move for the major. Hence, any meaningful pullback is likely to attract fresh buyers and remain limited.
Technical Levels: Supports and Resistances
USDCAD currently trading at 1.3553 at the time of writing. Pair opened at 1.354 and is trading with a change of 0.1 % .
| Overview | Overview.1 | |
|---|---|---|
| 0 | Today last price | 1.3553 |
| 1 | Today Daily Change | 0.0013 |
| 2 | Today Daily Change % | 0.1000 |
| 3 | Today daily open | 1.3540 |
The pair is trading above its 20 Daily moving average @ 1.348, below its 50 Daily moving average @ 1.3566 , above its 100 Daily moving average @ 1.3529 and above its 200 Daily moving average @ 1.3412
| Trends | Trends.1 | |
|---|---|---|
| 0 | Daily SMA20 | 1.3480 |
| 1 | Daily SMA50 | 1.3566 |
| 2 | Daily SMA100 | 1.3529 |
| 3 | Daily SMA200 | 1.3412 |
The previous day high was 1.3563 while the previous day low was 1.3473. The daily 38.2% Fib levels comes at 1.3529, expected to provide support. Similarly, the daily 61.8% fib level is at 1.3507, expected to provide support.
Note the levels of interest below:
- Pivot support is noted at 1.3487, 1.3435, 1.3397
- Pivot resistance is noted at 1.3578, 1.3616, 1.3668
| Levels | Levels.1 |
|---|---|
| Previous Daily High | 1.3563 |
| Previous Daily Low | 1.3473 |
| Previous Weekly High | 1.3563 |
| Previous Weekly Low | 1.3343 |
| Previous Monthly High | 1.3862 |
| Previous Monthly Low | 1.3508 |
| Daily Fibonacci 38.2% | 1.3529 |
| Daily Fibonacci 61.8% | 1.3507 |
| Daily Pivot Point S1 | 1.3487 |
| Daily Pivot Point S2 | 1.3435 |
| Daily Pivot Point S3 | 1.3397 |
| Daily Pivot Point R1 | 1.3578 |
| Daily Pivot Point R2 | 1.3616 |
| Daily Pivot Point R3 | 1.3668 |
[/s2If]
Join Our Telegram Group
")


