#AUDJPY @ 89.6970 is struggling to find any direction ahead of Australian Inflation data. (Pivot Orderbook analysis)
…
This is a premium post.
[s2If !current_user_can(access_s2member_level4)]Please register for PREMIUM VERSION HERE to read full post below containing analysis. In case of any error or you think you are not able to read the full post below, please email us at support#nehcap.com [lwa][/s2If] [s2If current_user_can(access_s2member_level4)]
- AUD/JPY is struggling to find any direction ahead of Australian Inflation data.
- BoJ Ueda has reiterated the need of keeping monetary policy expansionary ahead.
- Further softening in Australian inflation will allow the RBA to continue its unchanged policy ahead.
The pair currently trades last at 89.6970.
The previous day high was 90.56 while the previous day low was 89.4. The daily 38.2% Fib levels comes at 89.85, expected to provide resistance. Similarly, the daily 61.8% fib level is at 90.12, expected to provide resistance.
The AUD/JPY pair is oscillating around 89.80 in the Asian session. The risk barometer is showing a lackluster performance despite novel Bank of Japan (BoJ) Governor Kazuo Ueda saying, “Japan’s consumer inflation, including index stripping away fuel costs, likely nearing its peak,” adding that he is “seeing it slowing ahead.” BoJ Ueda has reiterated the need of keeping monetary policy expansionary ahead.
This week, the release of the Australian Inflation data will determine the action in the risk barometer. As per the consensus, inflation data for the first quarter of CY2023 has decelerated to 1.3% from the prior release of 1.9%. Annual inflation has softened to 6.9% vs. the prior release of 7.8%. The monthly Consumer Price Index (CPI) indicator (March), which has been a major catalyst recently, is expected to show further softening to 6.5% against the former release of 6.8%.
Investors should note that the Reserve Bank of Australia (RBA) kept its interest rate policy steady in its April policy meeting. And, further softening in Australian inflation will allow the RBA to continue its unchanged policy ahead.
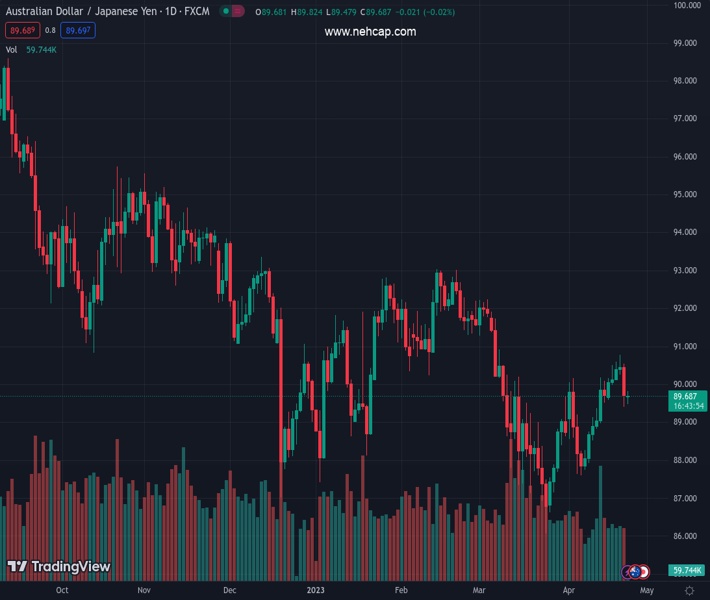
On a daily scale, AUD/JPY has scaled to near the downward-sloping trendline of the Descending Triangle chart pattern plotted from 13 September 2022 high at 98.58. The horizontal support of the aforementioned chart pattern is placed from 12 May 2022 low at 87.31.
The 50-period Exponential Moving Average (EMA) at 89.85 is overlapping the asset, indicating a consolidation ahead.
In addition, the Relative Strength Index (RSI) (14) is also oscillating in the 40.00-60.00, signaling that investors are awaiting a potential trigger.
Should the asset breaks above March 03 high at 92.25, Australian Dollar bulls will drive the asset towards February 21 high at 93.01 followed by 22 November 2022 high at 94.02.
Alternatively, a break below April 13 low at 88.98 will drag the risk barometer toward March 30 low at 88.40. A slippage below the latter will further drag the asset towards April 06 low at 87.59.
AUD/JPY daily chart
Technical Levels: Supports and Resistances
AUDJPY currently trading at 89.74 at the time of writing. Pair opened at 89.74 and is trading with a change of 0.0 % .
| Overview | Overview.1 | |
|---|---|---|
| 0 | Today last price | 89.74 |
| 1 | Today Daily Change | 0.00 |
| 2 | Today Daily Change % | 0.00 |
| 3 | Today daily open | 89.74 |
The pair is trading above its 20 Daily moving average @ 89.12, below its 50 Daily moving average @ 89.97 , below its 100 Daily moving average @ 90.4 and below its 200 Daily moving average @ 92.34
| Trends | Trends.1 | |
|---|---|---|
| 0 | Daily SMA20 | 89.12 |
| 1 | Daily SMA50 | 89.97 |
| 2 | Daily SMA100 | 90.40 |
| 3 | Daily SMA200 | 92.34 |
The previous day high was 90.56 while the previous day low was 89.4. The daily 38.2% Fib levels comes at 89.85, expected to provide resistance. Similarly, the daily 61.8% fib level is at 90.12, expected to provide resistance.
Note the levels of interest below:
- Pivot support is noted at 89.24, 88.74, 88.07
- Pivot resistance is noted at 90.4, 91.06, 91.56
| Levels | Levels.1 |
|---|---|
| Previous Daily High | 90.56 |
| Previous Daily Low | 89.40 |
| Previous Weekly High | 90.78 |
| Previous Weekly Low | 89.40 |
| Previous Monthly High | 92.25 |
| Previous Monthly Low | 86.06 |
| Daily Fibonacci 38.2% | 89.85 |
| Daily Fibonacci 61.8% | 90.12 |
| Daily Pivot Point S1 | 89.24 |
| Daily Pivot Point S2 | 88.74 |
| Daily Pivot Point S3 | 88.07 |
| Daily Pivot Point R1 | 90.40 |
| Daily Pivot Point R2 | 91.06 |
| Daily Pivot Point R3 | 91.56 |
[/s2If]
Join Our Telegram Group
")


