Oil prices are showing signs of volatility contraction following the footprints of a sideways US Dollar. (Pivot Orderbook analysis)
…
This is a premium post.
[s2If !current_user_can(access_s2member_level4)]Please register for PREMIUM VERSION HERE to read full post below containing analysis. In case of any error or you think you are not able to read the full post below, please email us at support#nehcap.com [lwa][/s2If] [s2If current_user_can(access_s2member_level4)]
- Oil prices are showing signs of volatility contraction following the footprints of a sideways US Dollar.
- More rate hikes from central banks would put a serious dent in the oil demand.
- The black gold is expected to surrender entire gains generated after the announcement of production cuts by OPEC+.
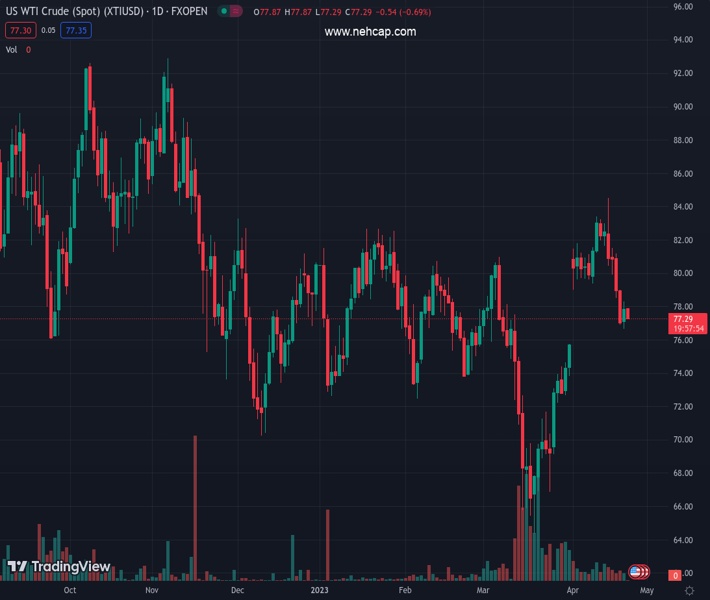
The pair currently trades last at 77.48.
The previous day high was 78.34 while the previous day low was 76.69. The daily 38.2% Fib levels comes at 77.71, expected to provide resistance. Similarly, the daily 61.8% fib level is at 77.32, expected to provide support.
West Texas Intermediate (WTI), futures on NYMEX, are showing signs of volatility contraction around $77.60 in the Asian session. The oil price showed a decent recovery after cracking to near $76.70 but is struggling for extending its recovery further as investors are worried that more rate hikes from Western central banks to strengthen their dominance on stubborn inflation would put a serious dent in oil demand.
Western central banks are preparing for a fresh rate hike cycle for May. The Bank of England (BoE) and the Federal Reserve (Fed) are expected to raise interest rates further by 25 basis points (bps). Meanwhile, investors are divided over the pace of the interest rate hike by the European Central Bank (ECB).
Meanwhile, the US Dollar Index (DXY) has shown a rebound move after defending its crucial support of 101.63. The recovery move by the USD Index is yet to go through more filters to infuse confidence among investors that the rebound is for real.
The oil price witnessed a steep fall after dropping below the crucial support placed from April 03 low at $79.00, which has turned into resistance for bulls. The downside move in the black gold is expected to surrender entire gains generated after the surprise announcement of production cuts by OPEC+.
The 20-period Exponential Moving Average (EMA) at $77.88 is acting as a barricade for the oil bulls.
Meanwhile, the Relative Strength Index (RSI) (14) is expected to fall back within the bearish range of 20.00-40.00.
Going forward, a decisive downside below $75.00 will expose the oil price to March 30 low at $72.69 followed by the round-level support at $70.00.
On the flip side, a confident break above April 03 low at $79.00 will drive the oil price toward April 04 high at $81.80 and April 12 high at $83.40.
Technical Levels: Supports and Resistances
XTIUSD currently trading at 77.48 at the time of writing. Pair opened at 77.92 and is trading with a change of -0.56 % .
| Overview | Overview.1 | |
|---|---|---|
| 0 | Today last price | 77.48 |
| 1 | Today Daily Change | -0.44 |
| 2 | Today Daily Change % | -0.56 |
| 3 | Today daily open | 77.92 |
The pair is trading below its 20 Daily moving average @ 78.32, above its 50 Daily moving average @ 76.41 , above its 100 Daily moving average @ 76.94 and below its 200 Daily moving average @ 82.15
| Trends | Trends.1 | |
|---|---|---|
| 0 | Daily SMA20 | 78.32 |
| 1 | Daily SMA50 | 76.41 |
| 2 | Daily SMA100 | 76.94 |
| 3 | Daily SMA200 | 82.15 |
The previous day high was 78.34 while the previous day low was 76.69. The daily 38.2% Fib levels comes at 77.71, expected to provide resistance. Similarly, the daily 61.8% fib level is at 77.32, expected to provide support.
Note the levels of interest below:
- Pivot support is noted at 76.96, 76.0, 75.31
- Pivot resistance is noted at 78.61, 79.3, 80.26
| Levels | Levels.1 |
|---|---|
| Previous Daily High | 78.34 |
| Previous Daily Low | 76.69 |
| Previous Weekly High | 82.61 |
| Previous Weekly Low | 76.69 |
| Previous Monthly High | 80.99 |
| Previous Monthly Low | 64.39 |
| Daily Fibonacci 38.2% | 77.71 |
| Daily Fibonacci 61.8% | 77.32 |
| Daily Pivot Point S1 | 76.96 |
| Daily Pivot Point S2 | 76.00 |
| Daily Pivot Point S3 | 75.31 |
| Daily Pivot Point R1 | 78.61 |
| Daily Pivot Point R2 | 79.30 |
| Daily Pivot Point R3 | 80.26 |
[/s2If]
Join Our Telegram Group


