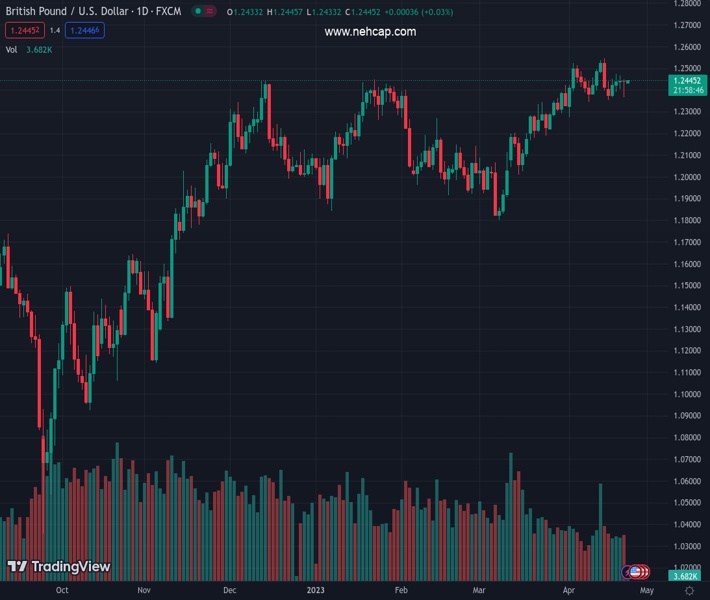
#GBPUSD @ 1.24433 has stretched its recovery above 1.2440 as USD Index is struggling to defend its four-day support. (Pivot Orderbook analysis)
…
This is a premium post.
[s2If !current_user_can(access_s2member_level4)]Please register for PREMIUM VERSION HERE to read full post below containing analysis. In case of any error or you think you are not able to read the full post below, please email us at support#nehcap.com [lwa][/s2If] [s2If current_user_can(access_s2member_level4)]
- GBP/USD has stretched its recovery above 1.2440 as USD Index is struggling to defend its four-day support.
- BoE Ramsden warned that the central bank must stop the risk of high inflation becoming embedded in the economy.
- Consecutive Doji formations by GBP/USD indicate a sheer contraction in volatility.
The pair currently trades last at 1.24433.
The previous day high was 1.2448 while the previous day low was 1.2367. The daily 38.2% Fib levels comes at 1.2398, expected to provide support. Similarly, the daily 61.8% fib level is at 1.2417, expected to provide support.
The GBP/USD pair has rebounded sharply above 1.2440 in the early Tokyo session. The Cable is looking to extend its recovery ahead as investors are very much confident of further rate hikes from the Bank of England (BoE).
BoE Deputy Governor Dave Ramsden said in an interview with The Times that the central bank must stop the risk of high inflation becoming embedded in the economy. He added there were still signs of stubbornly high inflation. However, the United Kingdom Retail Sales data landed on Friday contracted more than expected. Monthly (March) Retail Sales data contracted by 0.9% while the street was anticipating a contraction of 0.5%. UK’s stubborn inflation has heavily impacted households’ retail demand.
Meanwhile, S&P500 futures are showing some losses in the early Asian session after a choppy Friday. Investors are witnessing a stock-specific action amid the quarterly earnings season, keeping investors risk-averse. The US Dollar Index (DXY) is struggling to defend the crucial support of 101.70.
Consecutive Doji candlesticks formation on the daily scale by GBP/USD indicates a sheer contraction in volatility. The Cable is struggling to find decisive movements amid an absence of a potential trigger. The 20-period Exponential Moving Average (EMA) at 1.2395 is providing cushion to the Pound Sterling.
Meanwhile, the Relative Strength Index (RSI) (14) has shown a loss in the upside momentum and has shifted into the 40.00-60.00 range.
Further stretch in recovery above April 13 high at 1.2537 will drive the asset towards a fresh 10-month high at 1.2597, which is 08 June 2022 high. A breach of the latter will expose the asset to May 27 high at 1.2667.
On the flip side, a slippage below April 10 low at 1.2345 will expose the asset to March 30 low at 1.2294 followed by March 27 low at 1.2219.
Technical Levels: Supports and Resistances
GBPUSD currently trading at 1.2446 at the time of writing. Pair opened at 1.2441 and is trading with a change of 0.04 % .
| Overview | Overview.1 | |
|---|---|---|
| 0 | Today last price | 1.2446 |
| 1 | Today Daily Change | 0.0005 |
| 2 | Today Daily Change % | 0.0400 |
| 3 | Today daily open | 1.2441 |
The pair remains strongly bullish on the daily timeframe. It trades above its 20 SMA @ 1.2413, 50 SMA 1.221, 100 SMA @ 1.2198 and 200 SMA @ 1.1927.
| Trends | Trends.1 | |
|---|---|---|
| 0 | Daily SMA20 | 1.2413 |
| 1 | Daily SMA50 | 1.2210 |
| 2 | Daily SMA100 | 1.2198 |
| 3 | Daily SMA200 | 1.1927 |
The previous day high was 1.2448 while the previous day low was 1.2367. The daily 38.2% Fib levels comes at 1.2398, expected to provide support. Similarly, the daily 61.8% fib level is at 1.2417, expected to provide support.
Note the levels of interest below:
- Pivot support is noted at 1.239, 1.2338, 1.2308
- Pivot resistance is noted at 1.2471, 1.25, 1.2552
| Levels | Levels.1 |
|---|---|
| Previous Daily High | 1.2448 |
| Previous Daily Low | 1.2367 |
| Previous Weekly High | 1.2474 |
| Previous Weekly Low | 1.2354 |
| Previous Monthly High | 1.2424 |
| Previous Monthly Low | 1.1803 |
| Daily Fibonacci 38.2% | 1.2398 |
| Daily Fibonacci 61.8% | 1.2417 |
| Daily Pivot Point S1 | 1.2390 |
| Daily Pivot Point S2 | 1.2338 |
| Daily Pivot Point S3 | 1.2308 |
| Daily Pivot Point R1 | 1.2471 |
| Daily Pivot Point R2 | 1.2500 |
| Daily Pivot Point R3 | 1.2552 |
[/s2If]
Join Our Telegram Group


