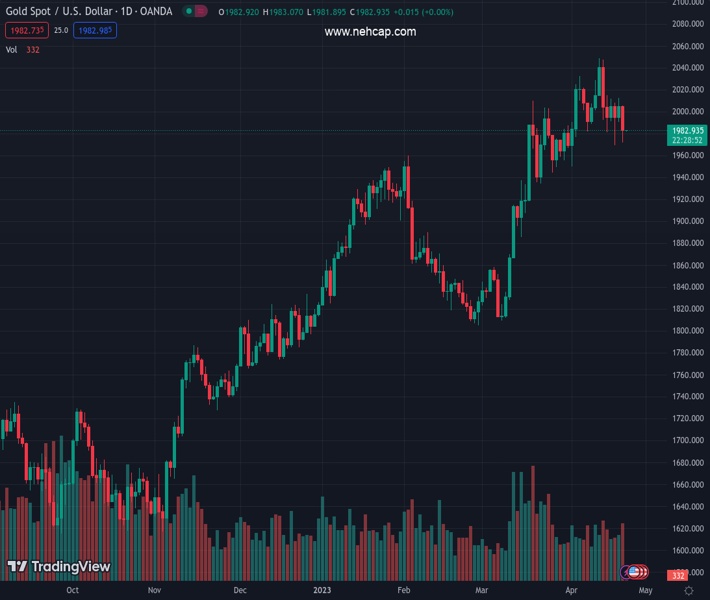
#XAUUSD @ 1,981.99 Gold price has stretched its recovery above $1,980.00 despite bets supportive of more rate hikes from the Fed. (Pivot Orderbook analysis)
…
This is a premium post.
[s2If !current_user_can(access_s2member_level4)]Please register for PREMIUM VERSION HERE to read full post below containing analysis. In case of any error or you think you are not able to read the full post below, please email us at support#nehcap.com [lwa][/s2If] [s2If current_user_can(access_s2member_level4)]
- Gold price has stretched its recovery above $1,980.00 despite bets supportive of more rate hikes from the Fed.
- The US Preliminary Manufacturing PMI figure landed above 50.0 for the first time in the past six months.
- Gold price is struggling to defend the cushion from the lower portion of a Rising Channel chart pattern.
The pair currently trades last at 1981.99.
The previous day high was 2005.58 while the previous day low was 1971.62. The daily 38.2% Fib levels comes at 1984.59, expected to provide resistance. Similarly, the daily 61.8% fib level is at 1992.61, expected to provide resistance.
Gold price (XAU/USD) showed a recovery move from near the crucial support of $1,970.00 and has stretched its recovery above $1,980.00 in the early Asian session. The precious metal has rebounded after a sheer sell-off despite solid preliminary United States S&P PMI data released on Friday.
S&P500 ended mild positive on Friday as significant movements remained stock-specific due to the quarterly result season, portraying a quiet market mood. The US Dollar Index (DXY) has remained topsy-turvy, ranging in a tight boundary of 101.63-102.14 for the past four trading sessions. Meanwhile, the demand for US government bonds trimmed further as bets for one more rate hike remain solid. This has led to a further jump in US Treasury yields. The yields offered on 10-year US bonds jumped to near 3.57%.
On Friday, the preliminary S&P Manufacturing data jumped to 50.4 from the consensus of 49.0 and the former release of 49.2. The figure landed above 50.0 for the first time in the past six months. A recovery in manufacturing activities in spite of higher interest rates from the Federal Reserve (Fed) and tight credit conditions from US commercial banks supports further policy tightening. This also hints that demand for labor will remain extremely tight.
In addition, preliminary Services PMI jumped to 53.7 from the estimates of 51.5 and the former release of 52.6. An all-around strength in the US economic activities is backing the need for more rate hikes from the Fed.
Gold price is struggling to defend the cushion from the lower portion of a Rising Channel chart pattern formed on a two-hour scale. The precious metal has shifted below the 200-period Exponential Moving Average (EMA) at $1,991.20, which indicates that the long-term trend has turned bearish. A slippage below the immediate support plotted from April 19 low at $1,969.26 will expose the asset to a fresh downside.
The Relative Strength Index (RSI) (14) has shifted its oscillation range into the 20.00-60.00 range indicating a bearish range shift.
Technical Levels: Supports and Resistances
XAUUSD currently trading at 1982.82 at the time of writing. Pair opened at 1983.02 and is trading with a change of -0.01 % .
| Overview | Overview.1 | |
|---|---|---|
| 0 | Today last price | 1982.82 |
| 1 | Today Daily Change | -0.20 |
| 2 | Today Daily Change % | -0.01 |
| 3 | Today daily open | 1983.02 |
The pair is trading below its 20 Daily moving average @ 1994.67, above its 50 Daily moving average @ 1919.91 , above its 100 Daily moving average @ 1887.1 and above its 200 Daily moving average @ 1800.37
| Trends | Trends.1 | |
|---|---|---|
| 0 | Daily SMA20 | 1994.67 |
| 1 | Daily SMA50 | 1919.91 |
| 2 | Daily SMA100 | 1887.10 |
| 3 | Daily SMA200 | 1800.37 |
The previous day high was 2005.58 while the previous day low was 1971.62. The daily 38.2% Fib levels comes at 1984.59, expected to provide resistance. Similarly, the daily 61.8% fib level is at 1992.61, expected to provide resistance.
Note the levels of interest below:
- Pivot support is noted at 1967.9, 1952.78, 1933.94
- Pivot resistance is noted at 2001.86, 2020.7, 2035.82
| Levels | Levels.1 |
|---|---|
| Previous Daily High | 2005.58 |
| Previous Daily Low | 1971.62 |
| Previous Weekly High | 2015.13 |
| Previous Weekly Low | 1969.26 |
| Previous Monthly High | 2009.88 |
| Previous Monthly Low | 1809.46 |
| Daily Fibonacci 38.2% | 1984.59 |
| Daily Fibonacci 61.8% | 1992.61 |
| Daily Pivot Point S1 | 1967.90 |
| Daily Pivot Point S2 | 1952.78 |
| Daily Pivot Point S3 | 1933.94 |
| Daily Pivot Point R1 | 2001.86 |
| Daily Pivot Point R2 | 2020.70 |
| Daily Pivot Point R3 | 2035.82 |
[/s2If]
Join Our Telegram Group


