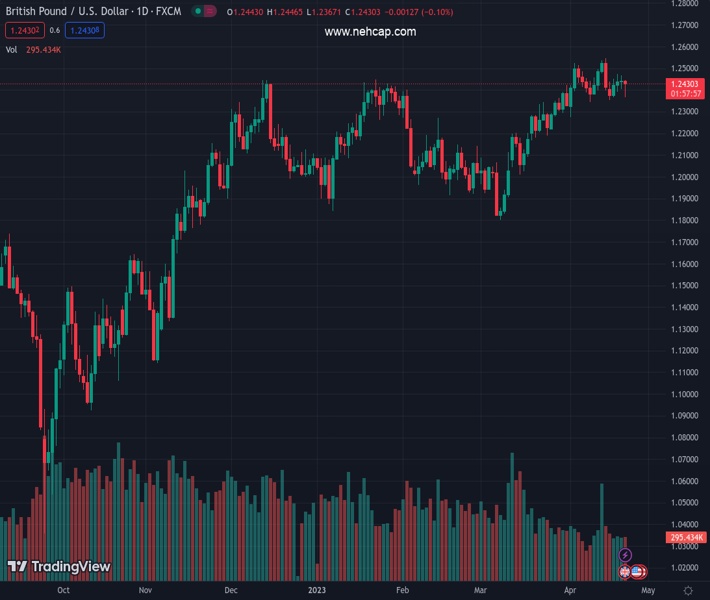
#GBPUSD @ 1.24299 cracking 1.2400 could trigger a bearish resumption, exposing 100 and 200-day EMAs at 1.2173. (Pivot Orderbook analysis)
…
This is a premium post.
[s2If !current_user_can(access_s2member_level4)]Please register for PREMIUM VERSION HERE to read full post below containing analysis. In case of any error or you think you are not able to read the full post below, please email us at support#nehcap.com [lwa][/s2If] [s2If current_user_can(access_s2member_level4)]
- GBP/USD cracking 1.2400 could trigger a bearish resumption, exposing 100 and 200-day EMAs at 1.2173.
- Buyers pushing GBP/USD above 1.2400 could spark upward momentum and test YTD high at 1.2546.
The pair currently trades last at 1.24299.
The previous day high was 1.2468 while the previous day low was 1.2405. The daily 38.2% Fib levels comes at 1.2444, expected to provide resistance. Similarly, the daily 61.8% fib level is at 1.2429, expected to provide support.
After a tranche of UK and US economic data, GBP/USD stays in sideways choppy trading, keeping the pair scrambling for direction following the last three days of uncertainty. From a technical perspective, three doji’s in a row suggests neither buyers’ nor sellers’ commitment to open fresh positions. Hence, GBP/USD is trading at 1.2439 after printing a low at 1.2367, below the 20-day Exponential Moving Average (EMA).
Friday’s session was titled downwards, but since the early North American session, the GBP/USD aimed up, about to erase its earlier losses. Although the GBP/USD warrants further upside, price action in the last few days suggests buyers might be losing momentum. Indicators, like the Relative Strength Index (RSI), turned flat though tilted downwards, heading into neutral territory. At the same time, the Rate of Change (RoC) edged lower when compared to Thursday’s price action, suggesting that buying pressure is fading.
Therefore, the GBP/USD path of least resistance is downwards. The GBP/USD needs to crack the 1.2400 figure for a bearish resumption. Once cleared, the pair could dive towards the 20-day EMA at 1.2386, followed by the confluence of the April 3 low and the 50-day EMA at 1.2274/76. A breach of the latter and the GBP/USD could plunge toward the confluence of the 100 and 200-day Emas, around 1.2173.
On the flip side, if GBP/USD stays above 1.2400, it could test the April 19 cycle high at 1.2474. Buyers reclaiming the latter, upside risks will clear at 1.2500, followed by the YTD high at 1.2546.
Technical Levels: Supports and Resistances
GBPUSD currently trading at 1.2437 at the time of writing. Pair opened at 1.2443 and is trading with a change of -0.05 % .
| Overview | Overview.1 | |
|---|---|---|
| 0 | Today last price | 1.2437 |
| 1 | Today Daily Change | -0.0006 |
| 2 | Today Daily Change % | -0.0500 |
| 3 | Today daily open | 1.2443 |
The pair remains strongly bullish on the daily timeframe. It trades above its 20 SMA @ 1.2402, 50 SMA 1.2202, 100 SMA @ 1.2196 and 200 SMA @ 1.1924.
| Trends | Trends.1 | |
|---|---|---|
| 0 | Daily SMA20 | 1.2402 |
| 1 | Daily SMA50 | 1.2202 |
| 2 | Daily SMA100 | 1.2196 |
| 3 | Daily SMA200 | 1.1924 |
The previous day high was 1.2468 while the previous day low was 1.2405. The daily 38.2% Fib levels comes at 1.2444, expected to provide resistance. Similarly, the daily 61.8% fib level is at 1.2429, expected to provide support.
Note the levels of interest below:
- Pivot support is noted at 1.2409, 1.2375, 1.2346
- Pivot resistance is noted at 1.2473, 1.2502, 1.2536
| Levels | Levels.1 |
|---|---|
| Previous Daily High | 1.2468 |
| Previous Daily Low | 1.2405 |
| Previous Weekly High | 1.2546 |
| Previous Weekly Low | 1.2344 |
| Previous Monthly High | 1.2424 |
| Previous Monthly Low | 1.1803 |
| Daily Fibonacci 38.2% | 1.2444 |
| Daily Fibonacci 61.8% | 1.2429 |
| Daily Pivot Point S1 | 1.2409 |
| Daily Pivot Point S2 | 1.2375 |
| Daily Pivot Point S3 | 1.2346 |
| Daily Pivot Point R1 | 1.2473 |
| Daily Pivot Point R2 | 1.2502 |
| Daily Pivot Point R3 | 1.2536 |
[/s2If]
Join Our Telegram Group


