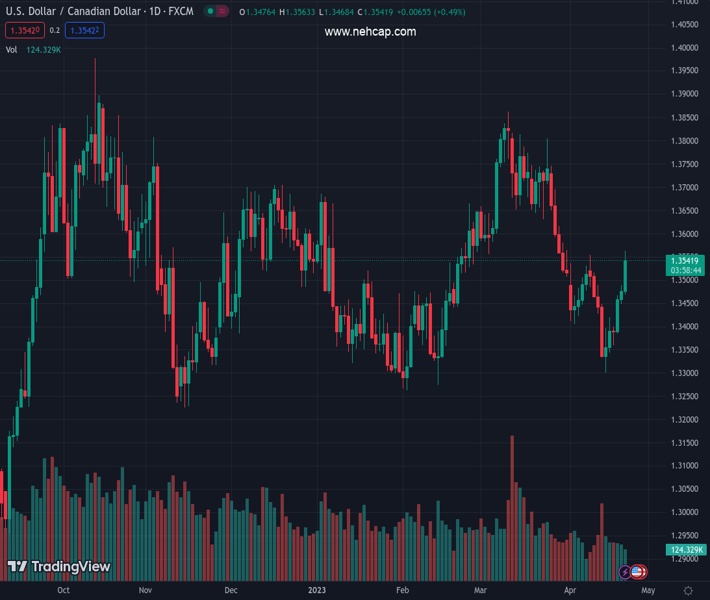
#USDCAD @ 1.35418 extended its gain in the week, bolstered by April’s PMIs reaching expansionary territory. (Pivot Orderbook analysis)
…
This is a premium post.
[s2If !current_user_can(access_s2member_level4)]Please register for PREMIUM VERSION HERE to read full post below containing analysis. In case of any error or you think you are not able to read the full post below, please email us at support#nehcap.com [lwa][/s2If] [s2If current_user_can(access_s2member_level4)]
- USD/CAD extended its gain in the week, bolstered by April’s PMIs reaching expansionary territory.
- The Canadian Dollar weakened as Retail Sales sank, though above estimates.
- USD/CAD Price Analysis: Bullish above 1.3520; otherwise, sellers could retest 1.3500.
The pair currently trades last at 1.35418.
The previous day high was 1.349 while the previous day low was 1.3449. The daily 38.2% Fib levels comes at 1.3474, expected to provide support. Similarly, the daily 61.8% fib level is at 1.3464, expected to provide support.
The USD/CAD reclaims the 1.3500 figure, advances after optimistic economic data in the US, pushed back against worries about growth. Meanwhile, Canadian Retail Sales missed estimates, indicating a slowdown in the economy. Hence, the USD/CAD is trading at 1.3532 after traveling to a low of 1.3468.
Wall Street continued to trade with losses after S&P Global reported that the activity of businesses in the United States (US) jumped. On its final reading, April’s S&P Global Manufacturing and Services PMIs rose above estimates at expansionary territory. Consequently, the Composite Index in the previous reading was 53.5, above 52.3.
Therefore, the USD/CAD rose sharply to the daily high above the R4 pivot point at 1.3558 before retracing to the R3 pivot at 1.3535. US bond yields edged up on growing concerns that business activity improvement could impact inflation to the upside, warranting higher interest rates.
The US Dollar Index, a gauge for the buck’s value against six currencies, erased some of its previous day losses, up 0.03%, at 101.825, a tailwind for the USD/CAD.
On Thursday, Federal Reserve policymakers continued their hawkish rhetoric. Philadelphia Fed President Patrick Harker suggested the US central bank is close to ending its campaign to control inflation. At the same time, Cleveland’s Loretta Mester believes rates should go above 5% due to high inflation. The current benchmark rate is between 4.75% and 5%.
On the Canadian front, Retail Sales for February plunged but were above forecasts of 0.6% MoM contraction, which stood at -0.2%, according to Statistics Canada. The data reinforce the Bank of Canada’s (BoC) decision to keep rates unchanged at their latest meeting.
The CME FedWatch Tool, which forecasts the next move of the US Federal Reserve (Fed), keeps odds at 88% for a 25 bps rate hike at the May 2-3 meeting.
The US economic docket will feature the Federal Reserve Governor Lisa Cook will cross newswires ahead of the media blackout that Fed officials would begin, ending with the Fed Chair Powell press conference on May 3.
The USD/CAD extended its rally to four out of five days a week, clearing on its uptrend, the 20, 100, and 50-day Exponential Moving Averages, each at 1.3488, 1.3501, and 1.3524, respectively. The Relative Strength Index (RSI) also crossed into bullish territory, suggesting further Canadian Dollar (CAD) weakness, meaning USD/CAD upside. If USD/CAD achieves a daily close above the 50-day EMA, the pair’s next resistance would be a ten-month-old prior’s support turned resistance trendline at around 1.3560-70. Once cleared, the next resistance would be 1.3600. Conversely, the USD/CAD could dive towards the 100-day EMA at 1.3501 before extending its losses towards the 20-day EMA at 1.3488.
Technical Levels: Supports and Resistances
USDCAD currently trading at 1.3537 at the time of writing. Pair opened at 1.3477 and is trading with a change of 0.45 % .
| Overview | Overview.1 | |
|---|---|---|
| 0 | Today last price | 1.3537 |
| 1 | Today Daily Change | 0.0060 |
| 2 | Today Daily Change % | 0.4500 |
| 3 | Today daily open | 1.3477 |
The pair is trading above its 20 Daily moving average @ 1.349, below its 50 Daily moving average @ 1.3563 , above its 100 Daily moving average @ 1.3529 and above its 200 Daily moving average @ 1.3409
| Trends | Trends.1 | |
|---|---|---|
| 0 | Daily SMA20 | 1.3490 |
| 1 | Daily SMA50 | 1.3563 |
| 2 | Daily SMA100 | 1.3529 |
| 3 | Daily SMA200 | 1.3409 |
The previous day high was 1.349 while the previous day low was 1.3449. The daily 38.2% Fib levels comes at 1.3474, expected to provide support. Similarly, the daily 61.8% fib level is at 1.3464, expected to provide support.
Note the levels of interest below:
- Pivot support is noted at 1.3454, 1.343, 1.3412
- Pivot resistance is noted at 1.3495, 1.3513, 1.3536
| Levels | Levels.1 |
|---|---|
| Previous Daily High | 1.3490 |
| Previous Daily Low | 1.3449 |
| Previous Weekly High | 1.3554 |
| Previous Weekly Low | 1.3301 |
| Previous Monthly High | 1.3862 |
| Previous Monthly Low | 1.3508 |
| Daily Fibonacci 38.2% | 1.3474 |
| Daily Fibonacci 61.8% | 1.3464 |
| Daily Pivot Point S1 | 1.3454 |
| Daily Pivot Point S2 | 1.3430 |
| Daily Pivot Point S3 | 1.3412 |
| Daily Pivot Point R1 | 1.3495 |
| Daily Pivot Point R2 | 1.3513 |
| Daily Pivot Point R3 | 1.3536 |
[/s2If]
Join Our Telegram Group


