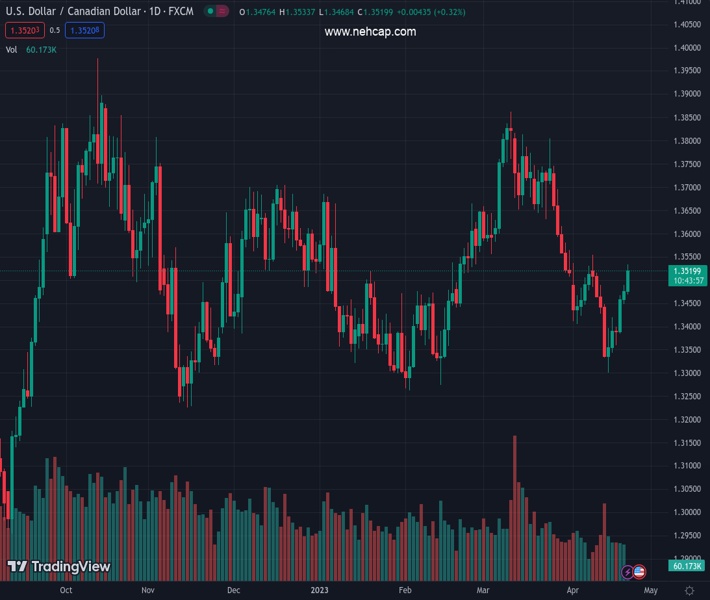
#USDCAD @ 1.35213 climbs to a nearly two-week high and draws support from a combination of factors. (Pivot Orderbook analysis)
…
This is a premium post.
[s2If !current_user_can(access_s2member_level4)]Please register for PREMIUM VERSION HERE to read full post below containing analysis. In case of any error or you think you are not able to read the full post below, please email us at support#nehcap.com [lwa][/s2If] [s2If current_user_can(access_s2member_level4)]
- USD/CAD climbs to a nearly two-week high and draws support from a combination of factors.
- The recent slump in Crude Oil prices continues to undermine the Loonie and acts as a tailwind.
- Bets for more Fed rate hikes and a softer risk tone lift the USD back closer to the weekly high.
The pair currently trades last at 1.35213.
The previous day high was 1.349 while the previous day low was 1.3449. The daily 38.2% Fib levels comes at 1.3474, expected to provide support. Similarly, the daily 61.8% fib level is at 1.3464, expected to provide support.
The USD/CAD pair gains traction for the third successive day on Friday, also marking the fifth day of a positive move in the previous six, and touches a nearly two-week high, around the 1.3535 region during the first half of the European session.
Crude Oil prices languish near the monthly low amid worries that a deeper global economic downturn will dent fuel demand and undermines the commodity-linked Loonie. Apart from this, signs of cooling consumer inflation in Canada undermine the Canadian Dollar and assist the USD/CAD pair to build on its recent bounce from the 1.3300 mark, or a two-month low touched last Friday. This, along with the emergence of fresh US Dollar (USD) buying acts as a tailwind for the major.
In fact, the USD Index, which tracks the Greenback against a basket of currencies, climbs back closer to the weekly high amid growing acceptance of further policy tightening by the Federal Reserve (Fed). In fact, the markets seem convinced that the US central bank will hike rates by 25 bps in May and have been pricing in a small chance of another rate hike in June. This, along with a generally weaker tone around the equity markets, further benefits the Greenback’s safe-haven status.
Friday’s follow-through move-up could further be attributed to some technical buying above the 1.3500 psychological mark. This, along with the aforementioned fundamental backdrop suggests that the path of least resistance for the USD/CAD pair is to the upside. Traders now look to the flash US PMI prints, which along with the US bond yields and the broader risk sentiment, will drive the USD demand. Apart from this, Oil price dynamics should provide some impetus to the major.
Technical Levels: Supports and Resistances
USDCAD currently trading at 1.3521 at the time of writing. Pair opened at 1.3477 and is trading with a change of 0.33 % .
| Overview | Overview.1 | |
|---|---|---|
| 0 | Today last price | 1.3521 |
| 1 | Today Daily Change | 0.0044 |
| 2 | Today Daily Change % | 0.3300 |
| 3 | Today daily open | 1.3477 |
The pair is trading above its 20 Daily moving average @ 1.349, below its 50 Daily moving average @ 1.3563 , below its 100 Daily moving average @ 1.3529 and above its 200 Daily moving average @ 1.3409
| Trends | Trends.1 | |
|---|---|---|
| 0 | Daily SMA20 | 1.3490 |
| 1 | Daily SMA50 | 1.3563 |
| 2 | Daily SMA100 | 1.3529 |
| 3 | Daily SMA200 | 1.3409 |
The previous day high was 1.349 while the previous day low was 1.3449. The daily 38.2% Fib levels comes at 1.3474, expected to provide support. Similarly, the daily 61.8% fib level is at 1.3464, expected to provide support.
Note the levels of interest below:
- Pivot support is noted at 1.3454, 1.343, 1.3412
- Pivot resistance is noted at 1.3495, 1.3513, 1.3536
| Levels | Levels.1 |
|---|---|
| Previous Daily High | 1.3490 |
| Previous Daily Low | 1.3449 |
| Previous Weekly High | 1.3554 |
| Previous Weekly Low | 1.3301 |
| Previous Monthly High | 1.3862 |
| Previous Monthly Low | 1.3508 |
| Daily Fibonacci 38.2% | 1.3474 |
| Daily Fibonacci 61.8% | 1.3464 |
| Daily Pivot Point S1 | 1.3454 |
| Daily Pivot Point S2 | 1.3430 |
| Daily Pivot Point S3 | 1.3412 |
| Daily Pivot Point R1 | 1.3495 |
| Daily Pivot Point R2 | 1.3513 |
| Daily Pivot Point R3 | 1.3536 |
[/s2If]
Join Our Telegram Group


