Euro vs US Dollar trades in the mid 1.09s, rising slightly after the release of euro area S&P Global PMIs.
…
This is a premium post.
[s2If !current_user_can(access_s2member_level4)]Please register for PREMIUM VERSION HERE to read full post below containing analysis. In case of any error or you think you are not able to read the full post below, please email us at support#nehcap.com [lwa][/s2If] [s2If current_user_can(access_s2member_level4)]
- Euro vs US Dollar trades in the mid 1.09s, rising slightly after the release of euro area S&P Global PMIs.
- Euro further supported by comments from ECB’s Lagarde that Governing Council “still has some way to go.”
- US Dollar pressured after poor labor and manufacturing data on Thursday.
The Euro (EUR) snakes along in the mid 1.09s against its biggest counterpart, the US Dollar (USD), during the early European session on Friday. With the banking crisis now seemingly in the rear-view mirror the focus is back on the fight with inflation, and both currencies are benefiting from expectations of higher interest rates. More broadly, the EUR/USD pair appears to be undergoing a correction after making new year-to-date highs of 1.1075 on April 14.
From a technical perspective, the Euro-Dollar pair is in a medium-term uptrend which is expected to continue once the correction has finished. Scoping in, the steadily diminishing volatility on intraday charts is tracing out a triangle pattern, which suggests there will be a breakout move on the horizon.
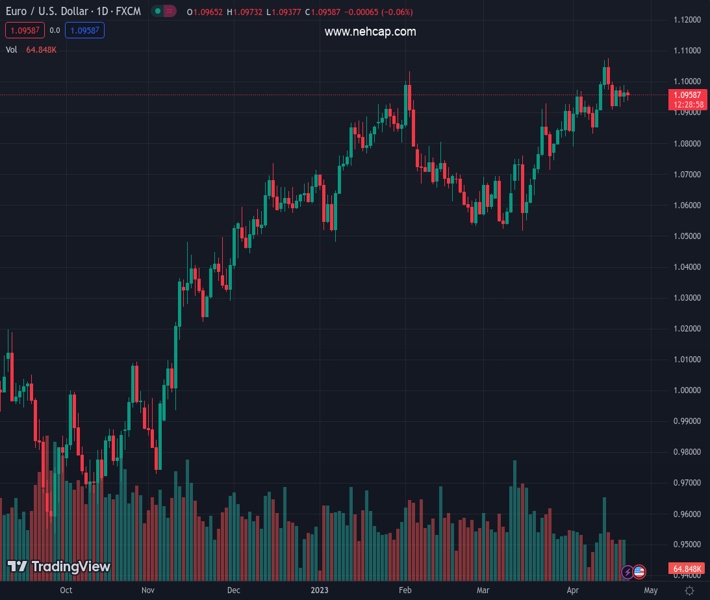
EUR/USD has been posting higher lows and higher highs since the September 2022 lows, and this medium-term uptrend is likely to continue. Following a correction in February 2023, EUR/USD recouped its losses in March and made new year-to-date highs above 1.1000 on April 13.
EUR/USD: Daily Chart
Drilling down to the 4-hour chart (below) and price action looks to be tracing out a triangle price pattern which will eventually break out either higher or lower. Triangles are usually composed of five waves. This one now looks complete. If so, then a breakout is likely close at hand.
EUR/USD: 4-hr Chart
The Chaikin Money Flow oscillator, is an indicator that is supposed to help give clues as to the eventual direction of a breakout from a range bound market, and it has kept below the zero-line during most of the evolution of the triangle, suggesting a slight bias towards expecting a downside break.
That said, the triangle has a flatter top suggesting it might be of the right-angled variety with a slight bullish bias.
Either way, if price pierces below the 1.0917 lows it will probably confirm a downside breakout, with a target at around 1.0850. Alternatively, a breach of 1.0990 high would confirm an upside breakout, which would likely retouch the 1.1075 year-to-date highs.
Taking a bigger-picture perspective, a break and daily close above the 1.1075 year-to-date highs of April 14 would indicate the overarching uptrend was kicking off again and suggest a move up to the next key resistance level at around 1.1190, where the 200-week Simple Moving Average (SMA) is situated.
For bears, a break and close below the important lower high at 1.0830 would bring into doubt the validity of the uptrend and could see losses extend down to a confluence of support at 1.0775-1.0800, and a possible reversal of the dominant trend.
[/s2If]
Join Our Telegram Group


