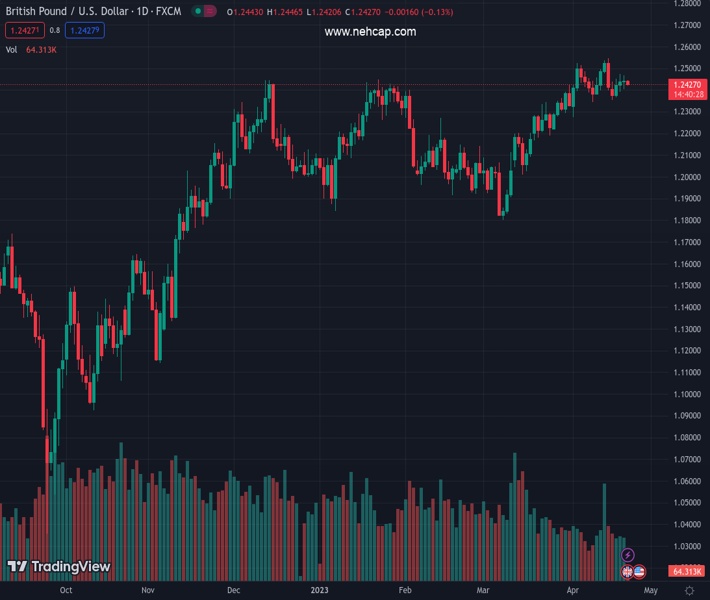
#GBPUSD @ 1.24269 edges lower on Friday and is pressured by a combination of factors. (Pivot Orderbook analysis)
…
This is a premium post.
[s2If !current_user_can(access_s2member_level4)]Please register for PREMIUM VERSION HERE to read full post below containing analysis. In case of any error or you think you are not able to read the full post below, please email us at support#nehcap.com [lwa][/s2If] [s2If current_user_can(access_s2member_level4)]
- GBP/USD edges lower on Friday and is pressured by a combination of factors.
- Bets for more Fed rate hikes and a softer risk tone benefits the safe-haven buck.
- The dismal UK Retail Sales weigh on the GBP and contribute to the downtick.
The pair currently trades last at 1.24269.
The previous day high was 1.2468 while the previous day low was 1.2405. The daily 38.2% Fib levels comes at 1.2444, expected to provide resistance. Similarly, the daily 61.8% fib level is at 1.2429, expected to provide resistance.
The GBP/USD pair comes under some selling pressure on the last day of the week and maintains its offered tone through the early European session. The pair currently trades around the 1.2425-1.2420 region, down over 0.15% for the day, and reacts little to the latest UK macro data.
The UK Office for National Statistics reported this Friday that domestic Retail Sales contracted more-than-expected, by 0.9% in March and reversed a major part of the rise recorded in the previous month. Furthermore, sales excluding fuel also missed consensus estimates and dropped by 1% during the reported month as compared to the 1.4% rise reported in February. This, in turn, undermines the British Pound, which, along with a modest US Dollar (USD) uptick, acts as a headwind for the GBP/USD pair.
The prospects for further policy tightening by the Federal Reserve (Fed), along with a softer risk tone, lend some support to the safe-haven Greenback. In fact, the markets seem convinced that the Federal Reserve will raise rates by 25 bps in May and have been pricing in a small chance of another rate hike in June, bolstered by the recent hawkish remarks by FOMC officials. This raises worries about economic headwinds stemming from rising borrowing costs, which tempers investors’ appetite for riskier assets.
The downside for the GBP/USD pair, however, seems cushioned, at least for the time being, amid rising bets for an additional interest rate hike by the Bank of England (BoE). Against the backdrop of stronger UK wage growth data released earlier this week, the stubbornly high inflation should keep pressure on the BoE to raise interest rates further. This makes it prudent to wait for strong follow-through selling before confirming that this week’s bounce from the 1.2350 strong horizontal support has run out of steam.
Nevertheless, the GBP/USD pair remains on track to register modest weekly gains as market participants now look forward to the release of the flash PMI prints from the UK and the US for a fresh impetus. This, along with the US bond yields and the broader risk sentiment, will influence the USD price dynamics and produce short-term trading opportunities around the GBP/USD pair heading into the weekend.
Technical Levels: Supports and Resistances
GBPUSD currently trading at 1.2432 at the time of writing. Pair opened at 1.2443 and is trading with a change of -0.09 % .
| Overview | Overview.1 | |
|---|---|---|
| 0 | Today last price | 1.2432 |
| 1 | Today Daily Change | -0.0011 |
| 2 | Today Daily Change % | -0.0900 |
| 3 | Today daily open | 1.2443 |
The pair remains strongly bullish on the daily timeframe. It trades above its 20 SMA @ 1.2402, 50 SMA 1.2202, 100 SMA @ 1.2196 and 200 SMA @ 1.1924.
| Trends | Trends.1 | |
|---|---|---|
| 0 | Daily SMA20 | 1.2402 |
| 1 | Daily SMA50 | 1.2202 |
| 2 | Daily SMA100 | 1.2196 |
| 3 | Daily SMA200 | 1.1924 |
The previous day high was 1.2468 while the previous day low was 1.2405. The daily 38.2% Fib levels comes at 1.2444, expected to provide resistance. Similarly, the daily 61.8% fib level is at 1.2429, expected to provide resistance.
Note the levels of interest below:
- Pivot support is noted at 1.2409, 1.2375, 1.2346
- Pivot resistance is noted at 1.2473, 1.2502, 1.2536
| Levels | Levels.1 |
|---|---|
| Previous Daily High | 1.2468 |
| Previous Daily Low | 1.2405 |
| Previous Weekly High | 1.2546 |
| Previous Weekly Low | 1.2344 |
| Previous Monthly High | 1.2424 |
| Previous Monthly Low | 1.1803 |
| Daily Fibonacci 38.2% | 1.2444 |
| Daily Fibonacci 61.8% | 1.2429 |
| Daily Pivot Point S1 | 1.2409 |
| Daily Pivot Point S2 | 1.2375 |
| Daily Pivot Point S3 | 1.2346 |
| Daily Pivot Point R1 | 1.2473 |
| Daily Pivot Point R2 | 1.2502 |
| Daily Pivot Point R3 | 1.2536 |
[/s2If]
Join Our Telegram Group


