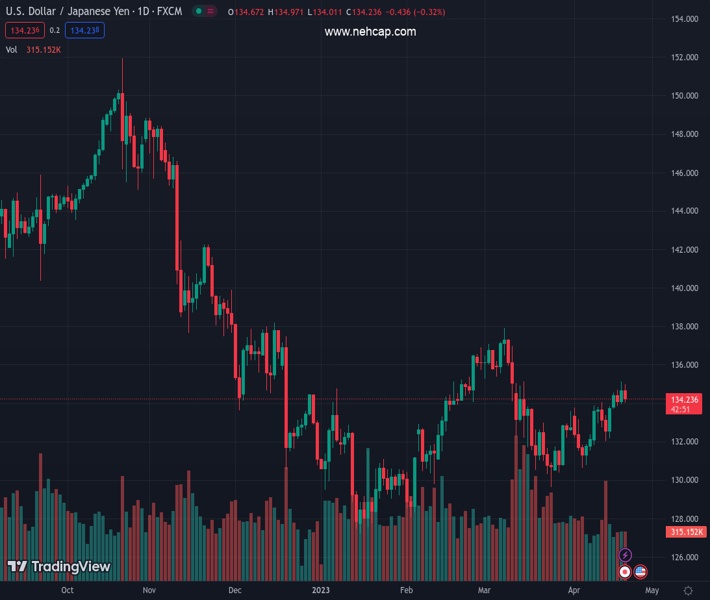
#USDJPY @ 134.233 is carving out the prospects of a deeper correction.
…
This is a premium post.
[s2If !current_user_can(access_s2member_level4)]Please register for PREMIUM VERSION HERE to read full post below containing analysis. In case of any error or you think you are not able to read the full post below, please email us at support#nehcap.com [lwa][/s2If] [s2If current_user_can(access_s2member_level4)]
- USD/JPY is carving out the prospects of a deeper correction.
- The bullish bias prevails while on the front side of the broader bullish trendline.
USD/JPY is down 0.26%, losing ground in late New York trade within the day´s range of 134.01 the earlier low and last Asian high of 134.97.
As per the prior analysis, USD/JPY Price Analysis: Bulls move in to test bears near 135.00, the price moved into the resistance and bulls threw in the towel and a break of structure leaves the focus on a fuller correction to the downside as the following illustrates:
It was stated that the overall bullish scenario, above, forecasted the prospects of a break of the micro trendline and a move to test the low 134s before the bulls engaged again for the push higher, as per the weekly W-formation´s outlook explained and illustrated in the prior analysis. A more bearish scenario, below, highlighted the chances of a breakdown into the broader trendline support.
We are seeing a break in the structure in the 134.20s which leaves the focus on the downside.
However, a bullish correction of the break in structure is underway and the following offers a potential trajectory in the price encompassing a correction and then a downside continuation:
Pulling up the Fibonacci scale, we can see that the prior support aligns with a cluster of Fibos between the 38.2% and 61.8% ratios and a 50% mean reversion in-between.
[/s2If]
Join Our Telegram Group


