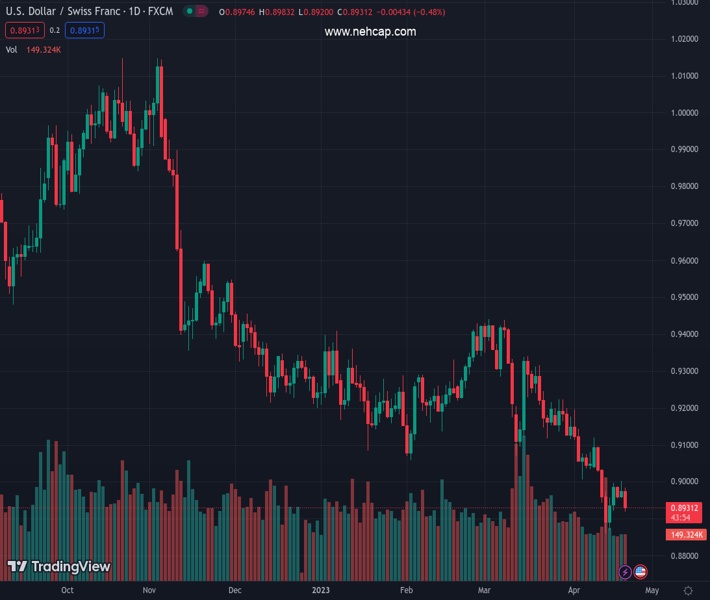
#USDCHF @ 0.89436 prepares to resume its bearish biased, confirmed by oscillators and sellers stepping in at around 0.9000. (Pivot Orderbook analysis)
…
This is a premium post.
[s2If !current_user_can(access_s2member_level4)]Please register for PREMIUM VERSION HERE to read full post below containing analysis. In case of any error or you think you are not able to read the full post below, please email us at support#nehcap.com [lwa][/s2If] [s2If current_user_can(access_s2member_level4)]
- USD/CHF prepares to resume its bearish biased, confirmed by oscillators and sellers stepping in at around 0.9000.
- If USD/CHF sellers reclaim 0.8900, look for a test of the YTD low at 0.8859.
- Upside risks lie above 0.9000, with buyers eyeing the 20-day EMA.
The pair currently trades last at 0.89436.
The previous day high was 0.9003 while the previous day low was 0.8958. The daily 38.2% Fib levels comes at 0.8986, expected to provide resistance. Similarly, the daily 61.8% fib level is at 0.8975, expected to provide resistance.
USD/CHF reversed its course after hitting a weekly high of 0.9003 and fell, as the sellers remain committed to defending the 0.9000 figure. After consolidating for back-to-back days in the 0.8950-0.9000 range, the USD/CHF exchanges hands at 0.8933, down 0.45%.
The USD/CHF posted two positive days and remained in the front foot during the week before turning negative. Sellers are gathering momentum, as shown by the Relative Strength Index (RSI), which is stills in bearish territory. In addition, the Rate of Change (RoC) also turned bearish, suggesting that the USD/CHF pair could resume its downward bias.
If USD/CHF continues lower, the next support would be the April 14 daily low at 0.8866. Once broken, up next would be the YTD low at 0.8859, followed by the 0.8800 figure.
On the other hand, the USD/CHF first resistance would be the confluence of a one-month-old downslope trendline around 0.8990, followed by the 0.9000 figure. A breach of the latter, the USD/CHF can rally towards the 20-day Exponential Moving Average (EMA) at 0.9044 before aiming towards April 10 daily high at 0.9120.
Technical Levels: Supports and Resistances
USDCHF currently trading at 0.8937 at the time of writing. Pair opened at 0.8975 and is trading with a change of -0.42 % .
| Overview | Overview.1 | |
|---|---|---|
| 0 | Today last price | 0.8937 |
| 1 | Today Daily Change | -0.0038 |
| 2 | Today Daily Change % | -0.4200 |
| 3 | Today daily open | 0.8975 |
The pair remains strongly bearish on the daily time frame. It trades below the 20 SMA @ 0.9069, 50 SMA 0.9201, 100 SMA @ 0.9237 and 200 SMA @ 0.9476.
| Trends | Trends.1 | |
|---|---|---|
| 0 | Daily SMA20 | 0.9069 |
| 1 | Daily SMA50 | 0.9201 |
| 2 | Daily SMA100 | 0.9237 |
| 3 | Daily SMA200 | 0.9476 |
The previous day high was 0.9003 while the previous day low was 0.8958. The daily 38.2% Fib levels comes at 0.8986, expected to provide resistance. Similarly, the daily 61.8% fib level is at 0.8975, expected to provide resistance.
Note the levels of interest below:
- Pivot support is noted at 0.8954, 0.8934, 0.8909
- Pivot resistance is noted at 0.9, 0.9024, 0.9045
| Levels | Levels.1 |
|---|---|
| Previous Daily High | 0.9003 |
| Previous Daily Low | 0.8958 |
| Previous Weekly High | 0.9114 |
| Previous Weekly Low | 0.8860 |
| Previous Monthly High | 0.9440 |
| Previous Monthly Low | 0.9072 |
| Daily Fibonacci 38.2% | 0.8986 |
| Daily Fibonacci 61.8% | 0.8975 |
| Daily Pivot Point S1 | 0.8954 |
| Daily Pivot Point S2 | 0.8934 |
| Daily Pivot Point S3 | 0.8909 |
| Daily Pivot Point R1 | 0.9000 |
| Daily Pivot Point R2 | 0.9024 |
| Daily Pivot Point R3 | 0.9045 |
[/s2If]
Join Our Telegram Group
")


