#USDMXN @ 18.0130 Disappointing macroeconomic data releases from the US weigh on US Dollar. (Pivot Orderbook analysis)
…
This is a premium post.
[s2If !current_user_can(access_s2member_level4)]Please register for PREMIUM VERSION HERE to read full post below containing analysis. In case of any error or you think you are not able to read the full post below, please email us at support#nehcap.com [lwa][/s2If] [s2If current_user_can(access_s2member_level4)]
- Disappointing macroeconomic data releases from the US weigh on US Dollar.
- Fed’s Mester: Rates must peak above 5% and hold there for a while.
- Mexican Retail Sales missed estimates, according to INEGI, though
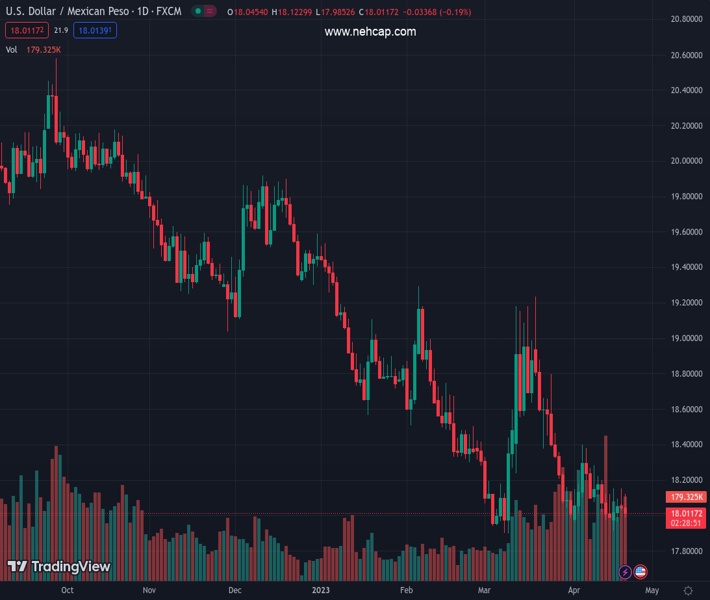
The pair currently trades last at 18.0130.
The previous day high was 18.1531 while the previous day low was 18.033. The daily 38.2% Fib levels comes at 18.0789, expected to provide resistance. Similarly, the daily 61.8% fib level is at 18.1072, expected to provide resistance.
The Mexican Peso (MXN) gains ground vs. the US Dollar (USD) and hovers around the 18.0000 figure for the first time in two days. A deceleration in the US, namely the labor market, housing, and manufacturing activity, in Philadelphia, spurred concerns about the status of the economy. At the time of writing, the USD/MXN is trading at 17.9910.
Despite a dented market sentiment, the USD/MXN continues to dive. US Initial Jobless Claims for the latest week rose above expectations, signaling that the labor market is easing. At the same time, the Philadelphia Fed Manufacturing Index was reported, which plunged to -31.3 beneath March’s -23.3, a headwind for the American Dollar (USD).
The US housing market continues to deteriorate as Existing Home Sales dropped -2.4% MoM, from 13.8% in February, which appeared to signal that housing had bottomed.
Fed policymakers continued another round of appearances in the media, led by the Cleveland Fed President Loretta Mester. She commented that she is happy with the progress on inflation though she reiterated that it’s too high. She expects rates to be above 5%, adding that the US economy is headed for slow growth, which could turn into a recession.
Retail Sales fell far more than expected on the Mexican front, according to the national statistics agency known as INEGI. Figures on a monthly bases dropped 0.3% vs. estimates of 0.2%, while annually rose by 3.4%, beneath estimates of 4%.
Technical Levels: Supports and Resistances
USDMXN currently trading at 18.0016 at the time of writing. Pair opened at 18.048 and is trading with a change of -0.26 % .
| Overview | Overview.1 | |
|---|---|---|
| 0 | Today last price | 18.0016 |
| 1 | Today Daily Change | -0.0464 |
| 2 | Today Daily Change % | -0.2600 |
| 3 | Today daily open | 18.0480 |
The pair remains strongly bearish on the daily time frame. It trades below the 20 SMA @ 18.164, 50 SMA 18.3443, 100 SMA @ 18.7876 and 200 SMA @ 19.3825.
| Trends | Trends.1 | |
|---|---|---|
| 0 | Daily SMA20 | 18.1640 |
| 1 | Daily SMA50 | 18.3443 |
| 2 | Daily SMA100 | 18.7876 |
| 3 | Daily SMA200 | 19.3825 |
The previous day high was 18.1531 while the previous day low was 18.033. The daily 38.2% Fib levels comes at 18.0789, expected to provide resistance. Similarly, the daily 61.8% fib level is at 18.1072, expected to provide resistance.
Note the levels of interest below:
- Pivot support is noted at 18.003, 17.9579, 17.8829
- Pivot resistance is noted at 18.1231, 18.1982, 18.2433
| Levels | Levels.1 |
|---|---|
| Previous Daily High | 18.1531 |
| Previous Daily Low | 18.0330 |
| Previous Weekly High | 18.2844 |
| Previous Weekly Low | 17.9753 |
| Previous Monthly High | 19.2324 |
| Previous Monthly Low | 17.8977 |
| Daily Fibonacci 38.2% | 18.0789 |
| Daily Fibonacci 61.8% | 18.1072 |
| Daily Pivot Point S1 | 18.0030 |
| Daily Pivot Point S2 | 17.9579 |
| Daily Pivot Point S3 | 17.8829 |
| Daily Pivot Point R1 | 18.1231 |
| Daily Pivot Point R2 | 18.1982 |
| Daily Pivot Point R3 | 18.2433 |
[/s2If]
Join Our Telegram Group
")


