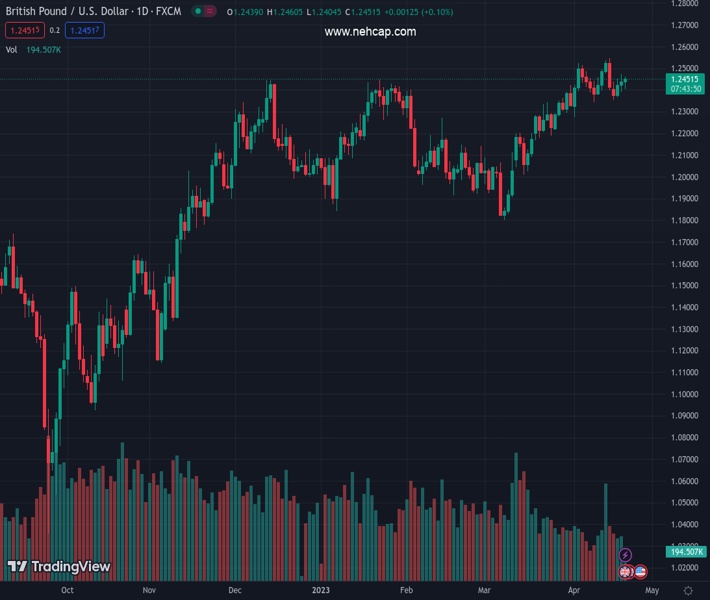
#GBPUSD @ 1.24535 attracts some dip-buying on Thursday and turns positive for the third straight day. (Pivot Orderbook analysis)
…
This is a premium post.
[s2If !current_user_can(access_s2member_level4)]Please register for PREMIUM VERSION HERE to read full post below containing analysis. In case of any error or you think you are not able to read the full post below, please email us at support#nehcap.com [lwa][/s2If] [s2If current_user_can(access_s2member_level4)]
- GBP/USD attracts some dip-buying on Thursday and turns positive for the third straight day.
- Retreating US bond yields undermines the safe-haven USD and lends support to the major.
- Bets for a 25 bps BoE rate hike in May act as a tailwind for the GBP and remain supportive.
The pair currently trades last at 1.24535.
The previous day high was 1.2474 while the previous day low was 1.2392. The daily 38.2% Fib levels comes at 1.2443, expected to provide support. Similarly, the daily 61.8% fib level is at 1.2424, expected to provide support.
The GBP/USD pair reverses an intraday dip to the 1.2400 round-figure mark and turns positive for the third successive day on Thursday. The pair, however, remain below the weekly high touched on Wednesday and trades around the 1.2450-1.2455 region, just below the weekly high touched on Wednesday.
The US Treasury bond yields stall the recent strong rally to a nearly one-month high, which, along with the disappointing US macro data, exerts some pressure on the US Dollar (USD). Apart from this, rising bets for another 25 bps rate hike by the Bank of England (BoE) in May underpin the British Pound and act as a tailwind for the GBP/USD pair.
That said, the prospects for further policy tightening by the Federal Reserve (Fed) should help limit the downside for the US bond yields. Furthermore, the risk-off impulse – as depicted by a generally weaker tone around the equity markets – could revive demand for the safe-haven Greenback and keep a lid on any meaningful gains for the GBP/USD pair.
From a technical perspective, spot prices this week found a decent support near the 1.2355-1.2350 region. The said area should now act as a pivotal point, which if broken might prompt some technical selling. The GBP/USD pair could then slide to the 1.2300 mark en route to the 100-day Simple Moving Average (SMA), just below the 1.2200 round figure.
On the flip side, bulls might wait for some follow-through buying beyond the overnight swing high, around the 1.2470-1.2475 region, before placing fresh bets. The GBP/USD pair might then surpass the 1.2500 psychological mark and then aim back to retesting the monthly swing high, around the 1.2545 region touched last week.
The momentum could get extended towards the 1.2600 round figure, above which spot prices could climb to the next relevant hurdle near the 1.2660-1.2665 region.
Technical Levels: Supports and Resistances
GBPUSD currently trading at 1.2443 at the time of writing. Pair opened at 1.244 and is trading with a change of 0.02 % .
| Overview | Overview.1 | |
|---|---|---|
| 0 | Today last price | 1.2443 |
| 1 | Today Daily Change | 0.0003 |
| 2 | Today Daily Change % | 0.0200 |
| 3 | Today daily open | 1.2440 |
The pair remains strongly bullish on the daily timeframe. It trades above its 20 SMA @ 1.2394, 50 SMA 1.2195, 100 SMA @ 1.2194 and 200 SMA @ 1.1921.
| Trends | Trends.1 | |
|---|---|---|
| 0 | Daily SMA20 | 1.2394 |
| 1 | Daily SMA50 | 1.2195 |
| 2 | Daily SMA100 | 1.2194 |
| 3 | Daily SMA200 | 1.1921 |
The previous day high was 1.2474 while the previous day low was 1.2392. The daily 38.2% Fib levels comes at 1.2443, expected to provide support. Similarly, the daily 61.8% fib level is at 1.2424, expected to provide support.
Note the levels of interest below:
- Pivot support is noted at 1.2397, 1.2354, 1.2315
- Pivot resistance is noted at 1.2478, 1.2517, 1.256
| Levels | Levels.1 |
|---|---|
| Previous Daily High | 1.2474 |
| Previous Daily Low | 1.2392 |
| Previous Weekly High | 1.2546 |
| Previous Weekly Low | 1.2344 |
| Previous Monthly High | 1.2424 |
| Previous Monthly Low | 1.1803 |
| Daily Fibonacci 38.2% | 1.2443 |
| Daily Fibonacci 61.8% | 1.2424 |
| Daily Pivot Point S1 | 1.2397 |
| Daily Pivot Point S2 | 1.2354 |
| Daily Pivot Point S3 | 1.2315 |
| Daily Pivot Point R1 | 1.2478 |
| Daily Pivot Point R2 | 1.2517 |
| Daily Pivot Point R3 | 1.2560 |
[/s2If]
Join Our Telegram Group
")


