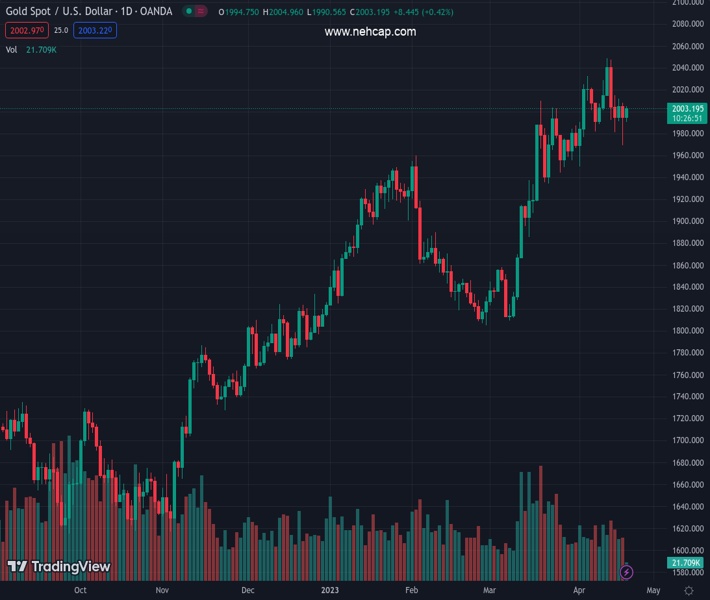
#XAUUSD @ 2,003.88 Gold price struggles to gain any meaningful traction on Thursday and oscillates in a narrow band. (Pivot Orderbook analysis)
…
This is a premium post.
[s2If !current_user_can(access_s2member_level4)]Please register for PREMIUM VERSION HERE to read full post below containing analysis. In case of any error or you think you are not able to read the full post below, please email us at support#nehcap.com [lwa][/s2If] [s2If current_user_can(access_s2member_level4)]
- Gold price struggles to gain any meaningful traction on Thursday and oscillates in a narrow band.
- Retreating US bond yields weighs on the US Dollar and lends support amid a weaker risk tone.
- Bets for more rate hikes by Federal Reserve act as a headwind and cap gains for the XAU/USD.
The pair currently trades last at 2003.88.
The previous day high was 2008.23 while the previous day low was 1969.26. The daily 38.2% Fib levels comes at 1984.15, expected to provide support. Similarly, the daily 61.8% fib level is at 1993.34, expected to provide support.
Gold price struggles to capitalize on the previous day’s late rebound from the $1,969 area, or over a two-week low, and seesaws between tepid gains/minor losses through the first half of the European session on Thursday. The XAU/USD is currently placed just below the $2,000 psychological mark, nearly unchanged for the day, and is influenced by a combination of diverging forces.
The US Treasury bond yields extend the overnight pullback from a nearly one-month high and exert some downward pressure on the US Dollar (USD). This, in turn, is seen as a key factor lending some support to the US Dollar-denominated Gold price. Apart from this, a fresh wave of global risk-aversion traders further benefits the safe-haven precious metal. That said, the prospects for further policy tightening by the Federal Reserve (Fed) act as a tailwind for the USD and cap the upside for the non-yielding XAU/USD.
In fact, the markets seem convinced that the Fed will continue raising interest rates to combat high inflation and have fully priced in a 25 basis point (bps) lift-off in May. Moreover, the Fed funds futures indicate a small chance of another rate hike at the June Federal Open Market Committee (FOMC) meeting and the bets were reaffirmed by the recent hawkish comments by Fed officials. New York Fed President John Williams said on Wednesday that inflation is still at problematic levels and the US central bank will act to lower it.
Furthermore, the Fed’s Beige Book showed that inflation in the United States (US) continued to run relatively high. Adding to this, the incoming US macro data pointed to a resilient economy and further fueled concerns that the Fed may have more work to do to contain inflation amid easing fears of a full-blown banking crisis. This should help limit the downside for the US Treasury bond yields and attract fresh USD buying at lower levels, suggesting that the path of least resistance for the Gold price remains to the downside.
Market participants now look to the US economic docket, featuring the release of the usual Weekly Initial Jobless Claim, the Philly Fed Manufacturing Index and Existing Home Sales data later during the early North American session. This, along with speeches by influential FOMC members and the US bond yields and the broader risk sentiment, will drive the USD demand and provide some impetus to Gold price. Traders will further take cues from the broader risk sentiment to grab short-term opportunities around the metal.
From a technical perspective, the overnight breakdown through the $1,980 horizontal support was seen as a fresh trigger for bearish traders. That said, the lack of follow-through selling and the subsequent recovery warrant caution before positioning for any further depreciating move. Meanwhile, any further move up might now confront resistance near the $2,012-$2,015 zone. A sustained strength beyond might trigger a fresh bout of a short-covering and lift Gold price beyond the $2,020 intermediate hurdle, towards the $2,040 horizontal resistance en route to the YTD peak, around the $2,047-$2,049 region.
On the flip side, the $1,980 area, followed by the overnight swing low, around the $1,969 region, now seems to act as immediate support. Given that oscillators on the daily chart have just started drifting in the negative territory, some follow-through selling should pave the way for an extension of the recent retracement slide from a one-year high. The Gold price might then slide towards testing the next relevant support near the $1,956-$1,955 area before eventually dropping to the monthly low around the $1,950 region.
Technical Levels: Supports and Resistances
XAUUSD currently trading at 1999.65 at the time of writing. Pair opened at 1995.08 and is trading with a change of 0.23 % .
| Overview | Overview.1 | |
|---|---|---|
| 0 | Today last price | 1999.65 |
| 1 | Today Daily Change | 4.57 |
| 2 | Today Daily Change % | 0.23 |
| 3 | Today daily open | 1995.08 |
The pair remains strongly bullish on the daily timeframe. It trades above its 20 SMA @ 1993.46, 50 SMA 1914.88, 100 SMA @ 1882.96 and 200 SMA @ 1797.66.
| Trends | Trends.1 | |
|---|---|---|
| 0 | Daily SMA20 | 1993.46 |
| 1 | Daily SMA50 | 1914.88 |
| 2 | Daily SMA100 | 1882.96 |
| 3 | Daily SMA200 | 1797.66 |
The previous day high was 2008.23 while the previous day low was 1969.26. The daily 38.2% Fib levels comes at 1984.15, expected to provide support. Similarly, the daily 61.8% fib level is at 1993.34, expected to provide support.
Note the levels of interest below:
- Pivot support is noted at 1973.48, 1951.89, 1934.51
- Pivot resistance is noted at 2012.45, 2029.83, 2051.42
| Levels | Levels.1 |
|---|---|
| Previous Daily High | 2008.23 |
| Previous Daily Low | 1969.26 |
| Previous Weekly High | 2048.75 |
| Previous Weekly Low | 1986.28 |
| Previous Monthly High | 2009.88 |
| Previous Monthly Low | 1809.46 |
| Daily Fibonacci 38.2% | 1984.15 |
| Daily Fibonacci 61.8% | 1993.34 |
| Daily Pivot Point S1 | 1973.48 |
| Daily Pivot Point S2 | 1951.89 |
| Daily Pivot Point S3 | 1934.51 |
| Daily Pivot Point R1 | 2012.45 |
| Daily Pivot Point R2 | 2029.83 |
| Daily Pivot Point R3 | 2051.42 |
[/s2If]
Join Our Telegram Group
")


