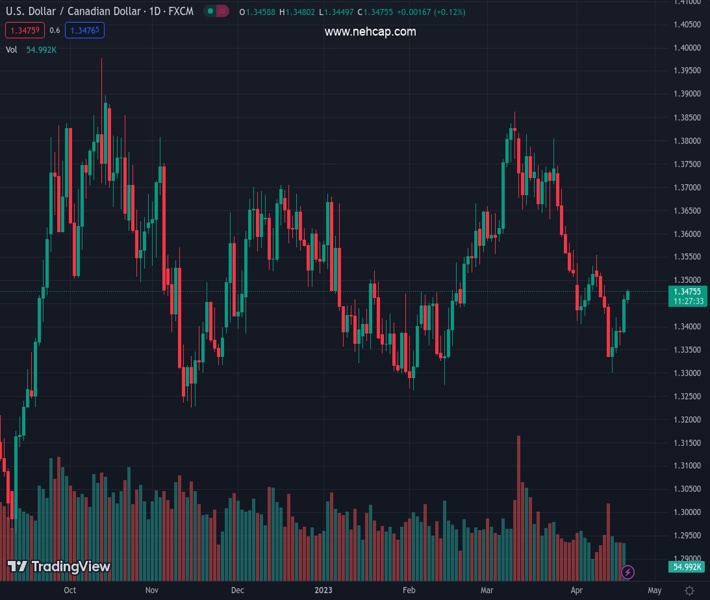
#USDCAD @ 1.34768 consolidates its recent strong recovery gains to over a one-week high. (Pivot Orderbook analysis)
…
This is a premium post.
[s2If !current_user_can(access_s2member_level4)]Please register for PREMIUM VERSION HERE to read full post below containing analysis. In case of any error or you think you are not able to read the full post below, please email us at support#nehcap.com [lwa][/s2If] [s2If current_user_can(access_s2member_level4)]
- USD/CAD consolidates its recent strong recovery gains to over a one-week high.
- Tumbling Crude Oil prices undermines the Loonie and lends support to the pair.
- A modest USD downtick caps the upside, though the setup favours bullish traders.
The pair currently trades last at 1.34768.
The previous day high was 1.3467 while the previous day low was 1.338. The daily 38.2% Fib levels comes at 1.3434, expected to provide support. Similarly, the daily 61.8% fib level is at 1.3413, expected to provide support.
The USD/CAD pair now seems to have entered a bullish consolidation phase and is seen oscillating in a narrow range around the 1.3470-1.3475 region, or over a one-week high touched this Wednesday.
Crude Oil prices tumble to a fresh monthly low amid worries that rising borrowing costs will slow economic growth and dent fuel demand. Apart from this, signs of cooling consumer inflation in Canada undermine the commodity-linked Lonie and assist the USD/CAD pair to build on the recent solid rebound from the 1.3300 mark, or a two-month low touched earlier this week. The upside, however, remains capped in the wake of a mildly softer tone surrounding the US Dollar, led by a modest downtick in the US Treasury bond yields.
That said, the prospects for further policy tightening by the Federal Reserve (Fed) should act as a tailwind for the US bond yields and limit the downside for the USD, at least for the time being. The markets now seem convinced that the US central bank will lift rates by 25 bps at the next policy meeting in May and have been pricing in a small chance of another rate hike in June. The bets were reaffirmed by the recent hawkish comments by several Fed officials and a rise in short-term inflation expectations, which, in turn, favours the USD bulls.
In fact, the Fed’s Beige Book released on Wednesday showed that US inflation continued to run relatively high. Furthermore, the incoming US macro data pointed to a resilient economy and fueled concerns that the Fed may have more work to do amid easing fears of a full-blown banking crisis. Apart from this, a generally weaker tone around the equity markets is seen as another factor benefitting the Greenback’s relative safe-haven assets, reaffirming the positive outlook and suggesting that the path of least resistance for the USD/CAD pair is to the upside.
Market participants now look to the US economic docket, featuring the release of the usual Weekly Initial Jobless Claim, the Philly Fed Manufacturing Index and Existing Home Sales data later during the early North American session. This, along with speeches by influential FOMC members, the US bond yields and the broader risk sentiment, will drive the USD demand and provide some impetus to the USD/CAD pair. Traders will further take cues from Oil price dynamics and the Bank of Canada (BoC) Governor Tiff Macklem’s scheduled speech.
Technical Levels: Supports and Resistances
USDCAD currently trading at 1.3473 at the time of writing. Pair opened at 1.3461 and is trading with a change of 0.09 % .
| Overview | Overview.1 | |
|---|---|---|
| 0 | Today last price | 1.3473 |
| 1 | Today Daily Change | 0.0012 |
| 2 | Today Daily Change % | 0.0900 |
| 3 | Today daily open | 1.3461 |
The pair is trading below its 20 Daily moving average @ 1.3502, below its 50 Daily moving average @ 1.3562 , below its 100 Daily moving average @ 1.3528 and above its 200 Daily moving average @ 1.3407
| Trends | Trends.1 | |
|---|---|---|
| 0 | Daily SMA20 | 1.3502 |
| 1 | Daily SMA50 | 1.3562 |
| 2 | Daily SMA100 | 1.3528 |
| 3 | Daily SMA200 | 1.3407 |
The previous day high was 1.3467 while the previous day low was 1.338. The daily 38.2% Fib levels comes at 1.3434, expected to provide support. Similarly, the daily 61.8% fib level is at 1.3413, expected to provide support.
Note the levels of interest below:
- Pivot support is noted at 1.3405, 1.3349, 1.3317
- Pivot resistance is noted at 1.3492, 1.3523, 1.358
| Levels | Levels.1 |
|---|---|
| Previous Daily High | 1.3467 |
| Previous Daily Low | 1.3380 |
| Previous Weekly High | 1.3554 |
| Previous Weekly Low | 1.3301 |
| Previous Monthly High | 1.3862 |
| Previous Monthly Low | 1.3508 |
| Daily Fibonacci 38.2% | 1.3434 |
| Daily Fibonacci 61.8% | 1.3413 |
| Daily Pivot Point S1 | 1.3405 |
| Daily Pivot Point S2 | 1.3349 |
| Daily Pivot Point S3 | 1.3317 |
| Daily Pivot Point R1 | 1.3492 |
| Daily Pivot Point R2 | 1.3523 |
| Daily Pivot Point R3 | 1.3580 |
[/s2If]
Join Our Telegram Group
")


