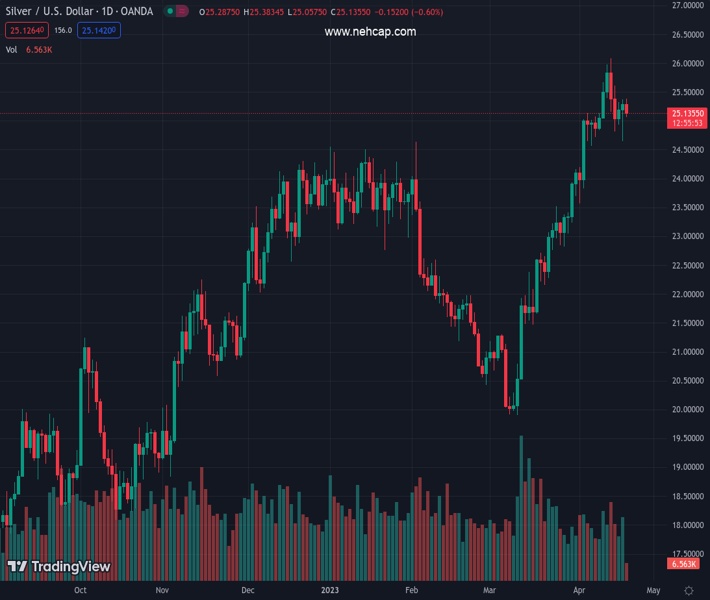
#XAGUSD @ 25.143 Silver lacks any firm intraday direction and oscillates in a narrow range on Thursday. (Pivot Orderbook analysis)
…
This is a premium post.
[s2If !current_user_can(access_s2member_level4)]Please register for PREMIUM VERSION HERE to read full post below containing analysis. In case of any error or you think you are not able to read the full post below, please email us at support#nehcap.com [lwa][/s2If] [s2If current_user_can(access_s2member_level4)]
- Silver lacks any firm intraday direction and oscillates in a narrow range on Thursday.
- The technical setup favours bulls and supports prospects for further near-term gains.
- A convincing break below the $24.00 mark is needed to negate the positive outlook.
The pair currently trades last at 25.143.
The previous day high was 25.37 while the previous day low was 24.64. The daily 38.2% Fib levels comes at 25.09, expected to provide support. Similarly, the daily 61.8% fib level is at 24.92, expected to provide support.
Silver struggles to capitalize on the overnight goodish rebound from the $24.65 region, or a one-and-half-week low, and seesaws between tepid gains/minor losses through the early European session on Thursday. The white metal, however, manages to hold its neck above the $25.00 psychological mark and for now, seems to have stalled the recent pullback from over a one-year high, around the $26.10 area touched last week.
Technical indicators on the daily chart, meanwhile, are holding comfortably in the positive territory and have already eased from the overbought zone. Adding to this, the overnight recovery from the 23.6% Fibonacci retracement level of the recent rally from the YTD low favours bullish traders and supports prospects for additional gains. Some follow-through buying beyond the $25.20-$25.25 area will reaffirm the positive outlook and lift the XAG/USD further towards the $25.80-$25.85 hurdle en route to the $26.00 mark.
On the flip side, the 23.6% Fibo., around the $24.65 area, now coincides with the 100-period Simple Moving Average (SMA) on the daily chart and should act as a pivotal point. This is closely followed by the $24.40-$24.30 strong horizontal resistance breakpoint, now turned support, which if broken could drag the XAG/USD towards the $24.00 mark en route to the 38.2% Fibo. level, around the $23.75 area.
Technical Levels: Supports and Resistances
XAGUSD currently trading at 25.21 at the time of writing. Pair opened at 25.29 and is trading with a change of -0.32 % .
| Overview | Overview.1 | |
|---|---|---|
| 0 | Today last price | 25.21 |
| 1 | Today Daily Change | -0.08 |
| 2 | Today Daily Change % | -0.32 |
| 3 | Today daily open | 25.29 |
The pair remains strongly bullish on the daily timeframe. It trades above its 20 SMA @ 24.41, 50 SMA 22.63, 100 SMA @ 23.05 and 200 SMA @ 21.35.
| Trends | Trends.1 | |
|---|---|---|
| 0 | Daily SMA20 | 24.41 |
| 1 | Daily SMA50 | 22.63 |
| 2 | Daily SMA100 | 23.05 |
| 3 | Daily SMA200 | 21.35 |
The previous day high was 25.37 while the previous day low was 24.64. The daily 38.2% Fib levels comes at 25.09, expected to provide support. Similarly, the daily 61.8% fib level is at 24.92, expected to provide support.
Note the levels of interest below:
- Pivot support is noted at 24.83, 24.38, 24.11
- Pivot resistance is noted at 25.56, 25.83, 26.29
| Levels | Levels.1 |
|---|---|
| Previous Daily High | 25.37 |
| Previous Daily Low | 24.64 |
| Previous Weekly High | 26.09 |
| Previous Weekly Low | 24.72 |
| Previous Monthly High | 24.16 |
| Previous Monthly Low | 19.90 |
| Daily Fibonacci 38.2% | 25.09 |
| Daily Fibonacci 61.8% | 24.92 |
| Daily Pivot Point S1 | 24.83 |
| Daily Pivot Point S2 | 24.38 |
| Daily Pivot Point S3 | 24.11 |
| Daily Pivot Point R1 | 25.56 |
| Daily Pivot Point R2 | 25.83 |
| Daily Pivot Point R3 | 26.29 |
[/s2If]
Join Our Telegram Group
")


