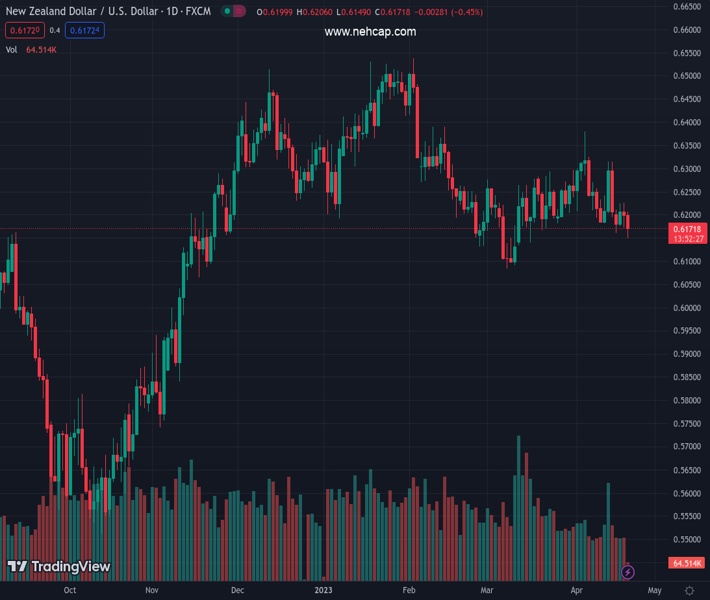
#NZDUSD @ 0.61717 dives to over one-month low in reaction to softer domestic consumer inflation figures. (Pivot Orderbook analysis)
…
This is a premium post.
[s2If !current_user_can(access_s2member_level4)]Please register for PREMIUM VERSION HERE to read full post below containing analysis. In case of any error or you think you are not able to read the full post below, please email us at support#nehcap.com [lwa][/s2If] [s2If current_user_can(access_s2member_level4)]
- NZD/USD dives to over one-month low in reaction to softer domestic consumer inflation figures.
- A modest downtick in the US bond yields undermines the USD and helps limit losses for the pair.
- The fundamental backdrop favours bearish traders and supports prospects for additional losses.
The pair currently trades last at 0.61717.
The previous day high was 0.6227 while the previous day low was 0.6172. The daily 38.2% Fib levels comes at 0.6193, expected to provide resistance. Similarly, the daily 61.8% fib level is at 0.6206, expected to provide resistance.
The NZD/USD pair comes under intense selling pressure on Thursday and drops to the 0.6150-0.6145 area, or over a one-month low
in reaction to the softer New Zealand consumer inflation figures. Spot prices, however, trim a part of heavy intraday losses and rebound to the 0.6175-0.6180 region during the early European session.
The US Dollar (USD) edges lower amid a modest downtick in the US Treasury bond yields and moves further away from a one-week high touched on Wednesday, which, in turn, is seen lending some support to the NZD/USD pair. That said, the prospects for further policy tightening by the Federal Reserve (Fed) should act as a tailwind for the US bond yields and limit the downside for the USD, at least for the time being.
In fact, the markets have nearly fully priced in a 25 bps lift-off in May and the Fed funds futures indicate a small chance of another rate hike in June. The bets were lifted by the recent hawkish comments by several Fed officials. Moreover, the incoming macro data from the US pointed to a resilient economy and fueled concerns that the Fed may have more work to do amid easing fears of a full-blown banking crisis.
Furthermore, data released earlier this Thursday showed that the headline CPI decelerated from the prior quarter’s 32-year high of 7.2% to 6.7% in the three months to March. This could be seen as the first sign of cooling inflation and entails a slightly less hawkish stance by the Reserve Bank of New Zealand (RBNZ), suggesting that the path of least resistance for the NZD/USD pair is to the downside.
Market participants now look to the US economic docket, featuring the release of the usual Weekly Initial Jobless Claim, the Philly Fed Manufacturing Index and Existing Home Sales data later during the early North American session. This, along with speeches by influential FOMC members, the US bond yields and the broader risk sentiment, will drive the USD demand and provide some impetus to the NZD/USD pair.
Technical Levels: Supports and Resistances
NZDUSD currently trading at 0.6177 at the time of writing. Pair opened at 0.62 and is trading with a change of -0.37 % .
| Overview | Overview.1 | |
|---|---|---|
| 0 | Today last price | 0.6177 |
| 1 | Today Daily Change | -0.0023 |
| 2 | Today Daily Change % | -0.3700 |
| 3 | Today daily open | 0.6200 |
The pair is trading below its 20 Daily moving average @ 0.6241, below its 50 Daily moving average @ 0.623 , below its 100 Daily moving average @ 0.6303 and above its 200 Daily moving average @ 0.6163
| Trends | Trends.1 | |
|---|---|---|
| 0 | Daily SMA20 | 0.6241 |
| 1 | Daily SMA50 | 0.6230 |
| 2 | Daily SMA100 | 0.6303 |
| 3 | Daily SMA200 | 0.6163 |
The previous day high was 0.6227 while the previous day low was 0.6172. The daily 38.2% Fib levels comes at 0.6193, expected to provide resistance. Similarly, the daily 61.8% fib level is at 0.6206, expected to provide resistance.
Note the levels of interest below:
- Pivot support is noted at 0.6173, 0.6145, 0.6118
- Pivot resistance is noted at 0.6228, 0.6255, 0.6283
| Levels | Levels.1 |
|---|---|
| Previous Daily High | 0.6227 |
| Previous Daily Low | 0.6172 |
| Previous Weekly High | 0.6316 |
| Previous Weekly Low | 0.6169 |
| Previous Monthly High | 0.6298 |
| Previous Monthly Low | 0.6084 |
| Daily Fibonacci 38.2% | 0.6193 |
| Daily Fibonacci 61.8% | 0.6206 |
| Daily Pivot Point S1 | 0.6173 |
| Daily Pivot Point S2 | 0.6145 |
| Daily Pivot Point S3 | 0.6118 |
| Daily Pivot Point R1 | 0.6228 |
| Daily Pivot Point R2 | 0.6255 |
| Daily Pivot Point R3 | 0.6283 |
[/s2If]
Join Our Telegram Group
")


