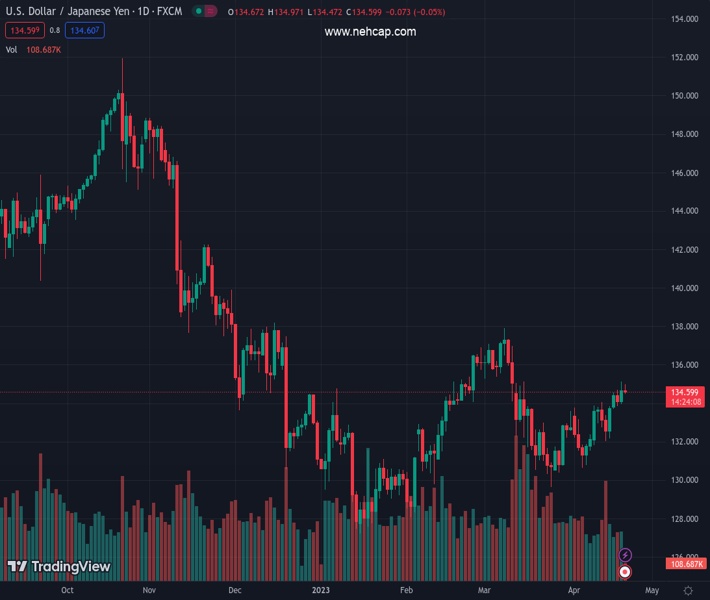
#USDJPY @ 134.550 eases from six-week high amid recently downbeat yields. (Pivot Orderbook analysis)
…
This is a premium post.
[s2If !current_user_can(access_s2member_level4)]Please register for PREMIUM VERSION HERE to read full post below containing analysis. In case of any error or you think you are not able to read the full post below, please email us at support#nehcap.com [lwa][/s2If] [s2If current_user_can(access_s2member_level4)]
- USD/JPY eases from six-week high amid recently downbeat yields.
- Upbeat economic analysis from BoJ, Fed troubles Yen pair buyers amid sluggish markets.
- Fears of higher rates, recession keep bulls hopeful ahead of second-tier US data, Japan inflation.
The pair currently trades last at 134.550.
The previous day high was 135.14 while the previous day low was 133.95. The daily 38.2% Fib levels comes at 134.69, expected to provide resistance. Similarly, the daily 61.8% fib level is at 134.41, expected to provide support.
USD/JPY aptly portrays the market’s inaction during early Thursday as traders await more clues to extend the latest run-up. That said, the Yen pair seesaws around 134.80, recently retreating from a six-week high marked the previous day.
Recently weighing on the Yen pair could be the headlines from the Bank of Japan (BoJ) as it maintains the overall upbeat economic assessment for seven of Japan’s nine regions. Furthermore, chatters that the BoJ can tweak the Yield Curve Control (YCC) policy if wage momentum holds, favored by Reuters, weigh on the USD/JPY prices.
It should be noted that the latest Fed Beige Book said, “Overall economic activity was little changed in recent weeks.” The report also mentioned that expectations for future growth were mostly unchanged as well.
On a broader front, the looming fears of economic recession, backed by hawkish signals from the major central banks, seem to propel the US Treasury bond yields and the US Dollar the previous day. Late Wednesday, New York Fed President John Williams marked support for a 0.25% interest rate hike in May while saying, “Inflation is still too high, and we will use our monetary policy tools to restore price stability.” Just before him was Chicago Federal Reserve Bank President Austan Goolsbee who highlighted credit market strength as one of the key catalysts to watch ahead of the next Fed monetary policy meeting.
Amid these plays, CME’s FedWatch Tool suggests that the market players place higher bets on the US central bank’s 0.25% rate hike in May, almost 85% at the latest, as well as reduce the probability of witnessing a rate cut in 2023. That said, the US 10-year and two-year Treasury bond yields grind near 3.60% and 4.25% respectively after refreshing the monthly top the previous day.
Elsewhere, geopolitical concerns surrounding China, Russia and the US also put a floor under the USD/JPY prices, due to the US Dollar’s haven demand. However, the recently mixed US data and doubt about the Fed’s future rate hike trajectory prod the Yen pair buyers.
As a result, the traders may closely observe today’s second-tier US data and comments from the Fed officials during their final round of public appearances before the blackout period for clear directions. Additionally, Friday’s Japan inflation data and the US PMIs are crucial for fresh impulse.
USD/JPY grinds higher between a one-month-old ascending trend line and the 200-day Exponential Moving Average (EMA), currently around 135.10 and 133.70 in that order.
Technical Levels: Supports and Resistances
USDJPY currently trading at 134.7 at the time of writing. Pair opened at 134.71 and is trading with a change of -0.01% % .
| Overview | Overview.1 | |
|---|---|---|
| 0 | Today last price | 134.7 |
| 1 | Today Daily Change | -0.01 |
| 2 | Today Daily Change % | -0.01% |
| 3 | Today daily open | 134.71 |
The pair is trading above its 20 Daily moving average @ 132.59, above its 50 Daily moving average @ 133.63 , above its 100 Daily moving average @ 133.02 and below its 200 Daily moving average @ 137.12
| Trends | Trends.1 | |
|---|---|---|
| 0 | Daily SMA20 | 132.59 |
| 1 | Daily SMA50 | 133.63 |
| 2 | Daily SMA100 | 133.02 |
| 3 | Daily SMA200 | 137.12 |
The previous day high was 135.14 while the previous day low was 133.95. The daily 38.2% Fib levels comes at 134.69, expected to provide resistance. Similarly, the daily 61.8% fib level is at 134.41, expected to provide support.
Note the levels of interest below:
- Pivot support is noted at 134.06, 133.41, 132.88
- Pivot resistance is noted at 135.25, 135.79, 136.44
| Levels | Levels.1 |
|---|---|
| Previous Daily High | 135.14 |
| Previous Daily Low | 133.95 |
| Previous Weekly High | 134.04 |
| Previous Weekly Low | 131.83 |
| Previous Monthly High | 137.91 |
| Previous Monthly Low | 129.64 |
| Daily Fibonacci 38.2% | 134.69 |
| Daily Fibonacci 61.8% | 134.41 |
| Daily Pivot Point S1 | 134.06 |
| Daily Pivot Point S2 | 133.41 |
| Daily Pivot Point S3 | 132.88 |
| Daily Pivot Point R1 | 135.25 |
| Daily Pivot Point R2 | 135.79 |
| Daily Pivot Point R3 | 136.44 |
[/s2If]
Join Our Telegram Group
")


