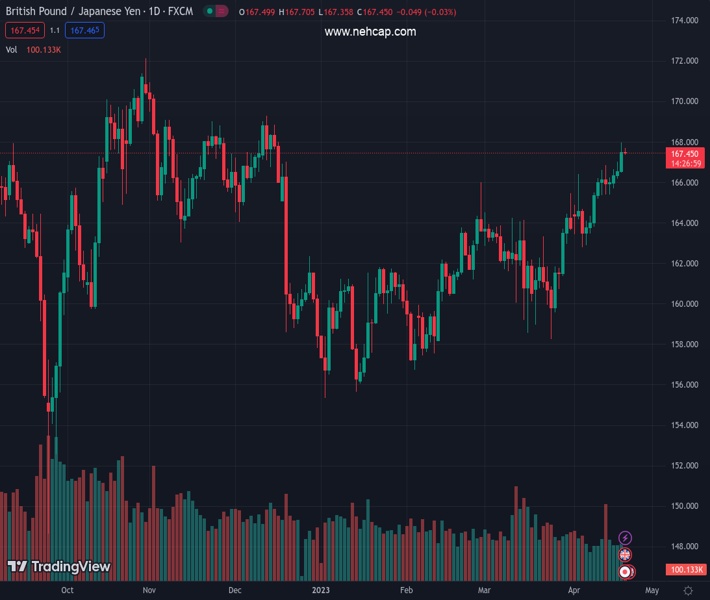
#GBPJPY @ 167.432 retreats from four-month high, prints the first daily loss in five., @nehcap view: Pullback expected (Pivot Orderbook analysis)
…
This is a premium post.
[s2If !current_user_can(access_s2member_level4)]Please register for PREMIUM VERSION HERE to read full post below containing analysis. In case of any error or you think you are not able to read the full post below, please email us at support#nehcap.com [lwa][/s2If] [s2If current_user_can(access_s2member_level4)]
- GBP/JPY retreats from four-month high, prints the first daily loss in five.
- Failures to stay beyond 168.00 joins bearish MACD signals to lure GBP/JPY bears.
- Resistance-turned-support from early April, steady RSI prods pair sellers.
- Upside break of the immediate trend line hurdle could aim for the late 2022 peak.
The pair currently trades last at 167.432.
The previous day high was 167.98 while the previous day low was 166.49. The daily 38.2% Fib levels comes at 167.41, expected to provide support. Similarly, the daily 61.8% fib level is at 167.06, expected to provide support.
GBP/JPY prints mild losses around 167.50 heading into Thursday’s London open. In doing so, the cross-currency pair consolidates the four-day uptrend at the highest levels since late 2022.
That said, the bearish MACD signals join the quote’s repeated failure to stay beyond the 168.00 round figure to lure the GBP/JPY pair sellers.
However, the steady RSI (14) line and a 12-day-old descending trend line, previous resistance around 167.00, restrict the immediate downside of the quote.
Following that, multiple lows marked during mid-April, near 164.50-40, will be in the spotlight.
It should be noted that a one-week-old horizontal area of around 165.40-50 could offer an intermediate halt to the GBP/JPY pair sellers between 167.00 and 164.40.
On the flip side, a downward-sloping trend line stretched from the previous day’s peak, around 167.65 at the latest, could quickly portray the pair’s other attempt to surpass the 168.00 figure.
Also acting as a short-term key upside hurdle is the late 2022 peak of 169.27 and the 170.00 round figure, a break of which could highlight the November 2022 high of nearly 172.15.
Trend: Pullback expected
Technical Levels: Supports and Resistances
GBPJPY currently trading at 167.5 at the time of writing. Pair opened at 167.58 and is trading with a change of -0.05% % .
| Overview | Overview.1 | |
|---|---|---|
| 0 | Today last price | 167.5 |
| 1 | Today Daily Change | -0.08 |
| 2 | Today Daily Change % | -0.05% |
| 3 | Today daily open | 167.58 |
The pair remains strongly bullish on the daily timeframe. It trades above its 20 SMA @ 164.34, 50 SMA 162.95, 100 SMA @ 162.19 and 200 SMA @ 163.26.
| Trends | Trends.1 | |
|---|---|---|
| 0 | Daily SMA20 | 164.34 |
| 1 | Daily SMA50 | 162.95 |
| 2 | Daily SMA100 | 162.19 |
| 3 | Daily SMA200 | 163.26 |
The previous day high was 167.98 while the previous day low was 166.49. The daily 38.2% Fib levels comes at 167.41, expected to provide support. Similarly, the daily 61.8% fib level is at 167.06, expected to provide support.
Note the levels of interest below:
- Pivot support is noted at 166.72, 165.86, 165.24
- Pivot resistance is noted at 168.21, 168.83, 169.69
| Levels | Levels.1 |
|---|---|
| Previous Daily High | 167.98 |
| Previous Daily Low | 166.49 |
| Previous Weekly High | 166.85 |
| Previous Weekly Low | 163.81 |
| Previous Monthly High | 165.47 |
| Previous Monthly Low | 158.27 |
| Daily Fibonacci 38.2% | 167.41 |
| Daily Fibonacci 61.8% | 167.06 |
| Daily Pivot Point S1 | 166.72 |
| Daily Pivot Point S2 | 165.86 |
| Daily Pivot Point S3 | 165.24 |
| Daily Pivot Point R1 | 168.21 |
| Daily Pivot Point R2 | 168.83 |
| Daily Pivot Point R3 | 169.69 |
[/s2If]
Join Our Telegram Group
")


