WTI bears are in the market despite OPEC production cut. (Pivot Orderbook analysis)
…
This is a premium post.
[s2If !current_user_can(access_s2member_level4)]Please register for PREMIUM VERSION HERE to read full post below containing analysis. In case of any error or you think you are not able to read the full post below, please email us at support#nehcap.com [lwa][/s2If] [s2If current_user_can(access_s2member_level4)]
- WTI bears are in the market despite OPEC production cut.
- US data unsettled markets, US Dollar rises.
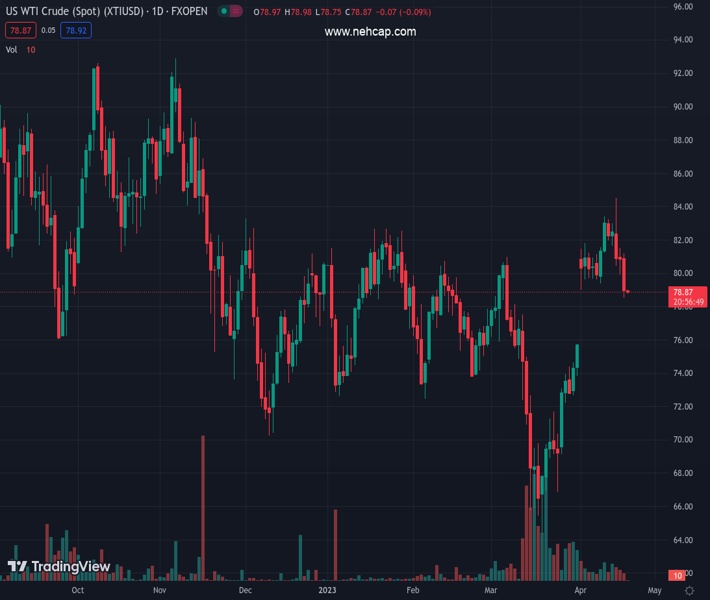
The pair currently trades last at 78.83.
The previous day high was 81.51 while the previous day low was 79.91. The daily 38.2% Fib levels comes at 80.52, expected to provide resistance. Similarly, the daily 61.8% fib level is at 80.9, expected to provide resistance.
West Texas Intermediate, WTI, crude oil was down some 0.2% at the time of writing but closed at the lowest point this month on Wednesday. WTI fell from a high of $81.15 and met a low of $78.58, slightly lower than the current spot price of $78.83.
The US Dollar was a driver mid-week as concerns that growth is slowing amid rising interest rates come back to the fore amid a hawkish Federal Reserve sentiment. An economic survey from the Federal Reserve showed the US economy stalled in recent weeks amid slower hiring and tighter credit. Meanwhile, the Federal Reserve is anticipated to continue pushing interest rates higher when its policy committee meets next month, with another 25-basis point hike seen as likely. WTI was sharply lower on fears of weaker demand increased.
Analysts at ANZ Bank referring to the US data explained that the data ´´unsettled markets, magnifying recent concerns that monetary tightening has weakened demand for oil.´´
Meanwhile, the analysts noted that the market shrugged off a relatively bullish EIA inventory report. ´´US commercial inventories of crude oil fell 4,581kbbl last week. However, a rise in gasoline inventories (+1,299kbbl) played to the concerns of weaker consumer demand. This could all dissipate as the impact of OPEC’s new production agreement starts to bite. The group’s cut of 1.1mb/d will not commence until 1 May. In the meantime, the market is likely to remain fixated on the demand outlook.´´
Oil was also lower despite OPEC+’s decision earlier this month to cut production to counter rising global inventories.
´´The significant short squeeze orchestrated by the announcement of OPEC+ production cuts appears to be running out of steam, leaving price action vulnerable to an oversupplied physical market in the very near-term,´´ analysts at TD Securities explained. ´´Still, time spreads continue to suggest that crude markets should tighten in coming months, suggesting physical markets will soon support price action.´´
The bears are in and eye a 38.2%fibonacci correction towards a close of the gap at $75.65bbls.
Technical Levels: Supports and Resistances
XTIUSD currently trading at 78.83 at the time of writing. Pair opened at 80.89 and is trading with a change of -2.55 % .
| Overview | Overview.1 | |
|---|---|---|
| 0 | Today last price | 78.83 |
| 1 | Today Daily Change | -2.06 |
| 2 | Today Daily Change % | -2.55 |
| 3 | Today daily open | 80.89 |
The pair is trading above its 20 Daily moving average @ 77.07, above its 50 Daily moving average @ 76.41 , above its 100 Daily moving average @ 77.01 and below its 200 Daily moving average @ 82.39
| Trends | Trends.1 | |
|---|---|---|
| 0 | Daily SMA20 | 77.07 |
| 1 | Daily SMA50 | 76.41 |
| 2 | Daily SMA100 | 77.01 |
| 3 | Daily SMA200 | 82.39 |
The previous day high was 81.51 while the previous day low was 79.91. The daily 38.2% Fib levels comes at 80.52, expected to provide resistance. Similarly, the daily 61.8% fib level is at 80.9, expected to provide resistance.
Note the levels of interest below:
- Pivot support is noted at 80.03, 79.17, 78.43
- Pivot resistance is noted at 81.63, 82.37, 83.23
| Levels | Levels.1 |
|---|---|
| Previous Daily High | 81.51 |
| Previous Daily Low | 79.91 |
| Previous Weekly High | 83.40 |
| Previous Weekly Low | 79.40 |
| Previous Monthly High | 80.99 |
| Previous Monthly Low | 64.39 |
| Daily Fibonacci 38.2% | 80.52 |
| Daily Fibonacci 61.8% | 80.90 |
| Daily Pivot Point S1 | 80.03 |
| Daily Pivot Point S2 | 79.17 |
| Daily Pivot Point S3 | 78.43 |
| Daily Pivot Point R1 | 81.63 |
| Daily Pivot Point R2 | 82.37 |
| Daily Pivot Point R3 | 83.23 |
[/s2If]
Join Our Telegram Group
")


