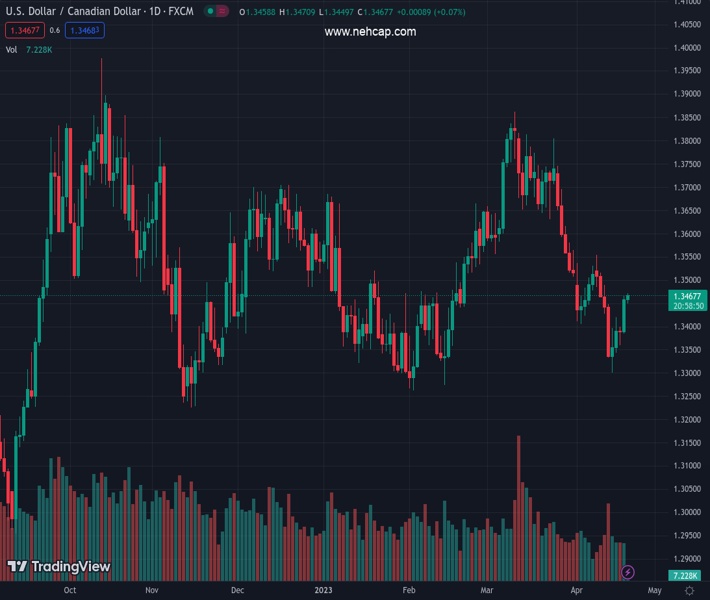
#USDCAD @ 1.34693 takes the bids to renew one-week high on crossing short-term key hurdles, now immediate supports., @nehcap view: Limited upside expected (Pivot Orderbook analysis)
…
This is a premium post.
[s2If !current_user_can(access_s2member_level4)]Please register for PREMIUM VERSION HERE to read full post below containing analysis. In case of any error or you think you are not able to read the full post below, please email us at support#nehcap.com [lwa][/s2If] [s2If current_user_can(access_s2member_level4)]
- USD/CAD takes the bids to renew one-week high on crossing short-term key hurdles, now immediate supports.
- 100-SMA, one-month-old descending trend line restrict immediate downside amid bullish MACD signals.
- Overbought RSI conditions suggest pullback from the 1.3500 round figure.
- 200-SMA acts as additional upside filters, bears need validation from 1.3320.
The pair currently trades last at 1.34693.
The previous day high was 1.34 while the previous day low was 1.336. The daily 38.2% Fib levels comes at 1.3375, expected to provide support. Similarly, the daily 61.8% fib level is at 1.3384, expected to provide support.
USD/CAD marches towards the 1.3500 threshold after crossing the short-term key resistances, around 1.3470 during Thursday’s Asian session.
In doing so, the Loonie pair cheers upside break of the one-month-old descending trend line, as well as the 100-SMA, respectively near 1.3465 and 1.3390.
It should be noted that the bullish MACD signals join the resistance breaks to keep USD/CAD buyers hopeful. However, the overbought RSI (14) restricts the quote’s further upside.
As a result, the USD/CAD bulls appear to have a limited upside room, which in turn highlights the 1.3500 round figure as an immediate hurdle ahead of the April 10 swing high of around 1.3555.
Following that, the 200-SMA hurdle of around 1.3595 and the 1.3600 round figure act as the final defense of the USD/CAD bears.
Meanwhile, a downside break of the 1.3390 resistance-turned-support isn’t an open welcome to the USD/CAD bears as an upward-sloping support line from February, close to 1.3320, becomes crucial to conquer for the Loonie pair sellers to retake control.
To sum up, USD/CAD remains on the bull’s radar but the road toward the north is long and bumpy.
Trend: Limited upside expected
Technical Levels: Supports and Resistances
USDCAD currently trading at 1.347 at the time of writing. Pair opened at 1.339 and is trading with a change of 0.60% % .
| Overview | Overview.1 | |
|---|---|---|
| 0 | Today last price | 1.347 |
| 1 | Today Daily Change | 0.0080 |
| 2 | Today Daily Change % | 0.60% |
| 3 | Today daily open | 1.339 |
The pair is trading below its 20 Daily moving average @ 1.3515, below its 50 Daily moving average @ 1.3562 , below its 100 Daily moving average @ 1.3528 and above its 200 Daily moving average @ 1.3405
| Trends | Trends.1 | |
|---|---|---|
| 0 | Daily SMA20 | 1.3515 |
| 1 | Daily SMA50 | 1.3562 |
| 2 | Daily SMA100 | 1.3528 |
| 3 | Daily SMA200 | 1.3405 |
The previous day high was 1.34 while the previous day low was 1.336. The daily 38.2% Fib levels comes at 1.3375, expected to provide support. Similarly, the daily 61.8% fib level is at 1.3384, expected to provide support.
Note the levels of interest below:
- Pivot support is noted at 1.3367, 1.3343, 1.3327
- Pivot resistance is noted at 1.3406, 1.3423, 1.3446
| Levels | Levels.1 |
|---|---|
| Previous Daily High | 1.3400 |
| Previous Daily Low | 1.3360 |
| Previous Weekly High | 1.3554 |
| Previous Weekly Low | 1.3301 |
| Previous Monthly High | 1.3862 |
| Previous Monthly Low | 1.3508 |
| Daily Fibonacci 38.2% | 1.3375 |
| Daily Fibonacci 61.8% | 1.3384 |
| Daily Pivot Point S1 | 1.3367 |
| Daily Pivot Point S2 | 1.3343 |
| Daily Pivot Point S3 | 1.3327 |
| Daily Pivot Point R1 | 1.3406 |
| Daily Pivot Point R2 | 1.3423 |
| Daily Pivot Point R3 | 1.3446 |
[/s2If]
Join Our Telegram Group
")


