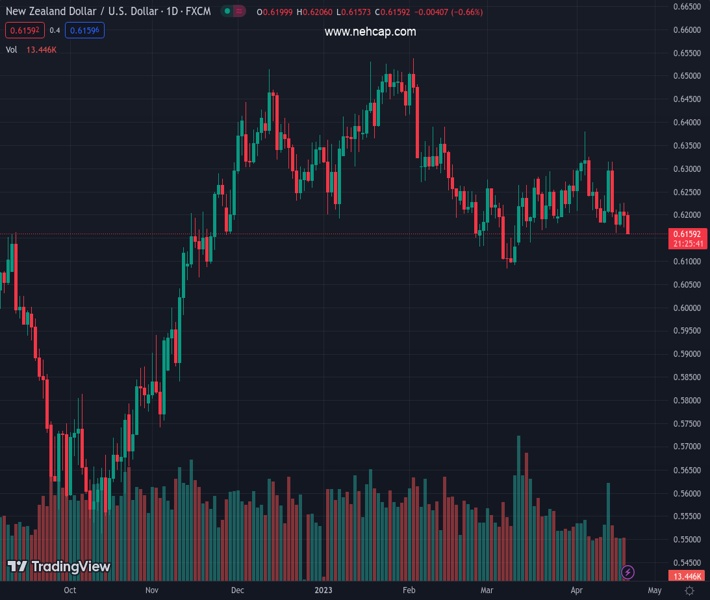
#NZDUSD @ 0.61623 has slipped sharply to near 0.6170 as NZ CPI has softened more than anticipated. (Pivot Orderbook analysis)
…
This is a premium post.
[s2If !current_user_can(access_s2member_level4)]Please register for PREMIUM VERSION HERE to read full post below containing analysis. In case of any error or you think you are not able to read the full post below, please email us at support#nehcap.com [lwa][/s2If] [s2If current_user_can(access_s2member_level4)]
- NZD/USD has slipped sharply to near 0.6170 as NZ CPI has softened more than anticipated.
- Quarterly CPI has accelerated by 1.2% vs. 1.7% as expected while annual CPI has dropped to 6.7% against 7.1% as estimated.
- The PBoC is expected to keep its LPR steady ahead.
The pair currently trades last at 0.61623.
The previous day high was 0.6226 while the previous day low was 0.6178. The daily 38.2% Fib levels comes at 0.6207, expected to provide resistance. Similarly, the daily 61.8% fib level is at 0.6196, expected to provide resistance.
The NZD/USD pair has slipped heavily to near 0.6170 as Statz New Zealand has reported lower-than-anticipated Consumer Price Index (CPI) data for the first quarter of CY2023. In the first quarter, inflationary pressures accelerated by 1.2% vs. the consensus of 1.7% and the former release of 1.4%. Annual inflation has softened to 6.7% while the street was anticipating a marginal deceleration to 7.1% from the prior release of 7.2%.
A significant decline in Kiwi inflation indicates that the Reserve Bank of New Zealand (RBNZ) is on the right track to arresting stick inflation. Investors should be aware of the fact that RBNZ Governor Adrian Orr raised interest rates surprisingly by 50 basis points (bps) to 5.25% in its last monetary policy meeting held on April 05.
Going forward, the interest rate decision by the People’s Bank of China (PBoC) will remain in the spotlight. A Reuters survey showed the PBoC is expected to keep its Loan Prime Rate (LPR) steady as economic recovery in China has been well on track. China’s Gross Domestic Product (GDP) for the first quarter landed matched upward revised estimates. Also, annual GDP figures remained better than projected, indicating prosperity after dismantling pandemic curbs.
It is worth noting that New Zealand is one of the leading trading partners of China and a stellar economic recovery in China will support the New Zealand Dollar.
Meanwhile, S&P futures are showing significant losses in the early Asian session amid discounting the impact of lighter corporate earnings by Netflix. This indicates that households are reluctant to pay for entertainment and are preferring spending on necessities due to the burden of higher inflation. The overall market mood is quite risk-averse.
The US Dollar Index (DXY) is struggling to recapture the critical resistance of 102.00. The upside in the USD Index looks capped after Federal Reserve’s (Fed) Beige Book showed that United States commercial banks have tightened credit conditions, which has resulted in lower disbursement of loans and advances to businesses and consumers.
Technical Levels: Supports and Resistances
NZDUSD currently trading at 0.62 at the time of writing. Pair opened at 0.6208 and is trading with a change of -0.13 % .
| Overview | Overview.1 | |
|---|---|---|
| 0 | Today last price | 0.6200 |
| 1 | Today Daily Change | -0.0008 |
| 2 | Today Daily Change % | -0.1300 |
| 3 | Today daily open | 0.6208 |
The pair is trading below its 20 Daily moving average @ 0.6242, below its 50 Daily moving average @ 0.6232 , below its 100 Daily moving average @ 0.6304 and above its 200 Daily moving average @ 0.6162
| Trends | Trends.1 | |
|---|---|---|
| 0 | Daily SMA20 | 0.6242 |
| 1 | Daily SMA50 | 0.6232 |
| 2 | Daily SMA100 | 0.6304 |
| 3 | Daily SMA200 | 0.6162 |
The previous day high was 0.6226 while the previous day low was 0.6178. The daily 38.2% Fib levels comes at 0.6207, expected to provide resistance. Similarly, the daily 61.8% fib level is at 0.6196, expected to provide resistance.
Note the levels of interest below:
- Pivot support is noted at 0.6182, 0.6156, 0.6134
- Pivot resistance is noted at 0.623, 0.6252, 0.6278
| Levels | Levels.1 |
|---|---|
| Previous Daily High | 0.6226 |
| Previous Daily Low | 0.6178 |
| Previous Weekly High | 0.6316 |
| Previous Weekly Low | 0.6169 |
| Previous Monthly High | 0.6298 |
| Previous Monthly Low | 0.6084 |
| Daily Fibonacci 38.2% | 0.6207 |
| Daily Fibonacci 61.8% | 0.6196 |
| Daily Pivot Point S1 | 0.6182 |
| Daily Pivot Point S2 | 0.6156 |
| Daily Pivot Point S3 | 0.6134 |
| Daily Pivot Point R1 | 0.6230 |
| Daily Pivot Point R2 | 0.6252 |
| Daily Pivot Point R3 | 0.6278 |
[/s2If]
Join Our Telegram Group
")


