#CADJPY @ 100.0330 The remained downward pressured by falling oil prices and a risk-off impulse. (Pivot Orderbook analysis)
…
This is a premium post.
[s2If !current_user_can(access_s2member_level4)]Please register for PREMIUM VERSION HERE to read full post below containing analysis. In case of any error or you think you are not able to read the full post below, please email us at support#nehcap.com [lwa][/s2If] [s2If current_user_can(access_s2member_level4)]
- The CAD/JPY remained downward pressured by falling oil prices and a risk-off impulse.
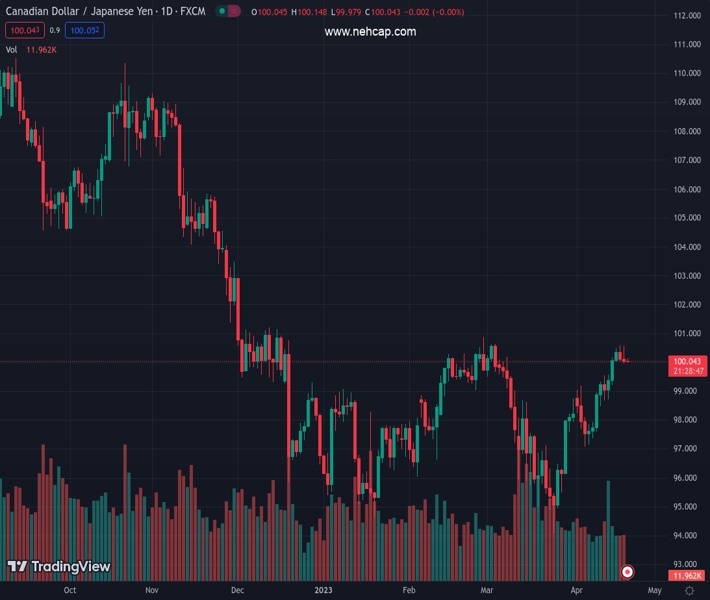
- From a daily chart perspective, the CAD/JPY is consolidating at around the 100.00-101.00 range.
- The CAD/JPY could shift downwards if buyers fail to hold prices above the 200-DMA.
The pair currently trades last at 100.0330.
The previous day high was 100.6 while the previous day low was 100.03. The daily 38.2% Fib levels comes at 100.25, expected to provide resistance. Similarly, the daily 61.8% fib level is at 100.38, expected to provide resistance.
The CAD/JPY faced solid resistance around 100.60 and retraced after posting a staggering 7.60% rally from March 24, when the pair printed its YTD low at 94.06. At the time of writing, the CAD/JPY is trading at 100.07, threatening to break below the 100.00 thresholds for the first time since April 14.
From a daily chart perspective, the CAD/JPY is neutral to upward biased, even though the pair broke above the 200-day EMA, lying at 99.90. Some fundamental news, like crude oil prices edging lower, weighed on the Canadian Dollar (CAD). In addition to the Relative Strength Index (RSI), turning flat and back-to-back bearish candlesticks could pave the way for a pullback.
If CAD/JPY breaks below the 200-day EMA, the 100-day EMA would be next at 99.26. If the pullback extends past the latter, a cluster of support lies at the 98.55/88 price level, the confluence of the 50 and 20-day EMAs, respectively., followed by April’s 5 cycle low at 97.09.
On the flip side, If CAD/JPY stays above 100.00, a test of the YTD high at 100.87 is on the cards. Once cleared, buyers could pose a threat to crack the 101.00 psychological level, followed by the next resistance, the November 30 high at 103.47.
Technical Levels: Supports and Resistances
CADJPY currently trading at 100.07 at the time of writing. Pair opened at 100.17 and is trading with a change of -0.1 % .
| Overview | Overview.1 | |
|---|---|---|
| 0 | Today last price | 100.07 |
| 1 | Today Daily Change | -0.10 |
| 2 | Today Daily Change % | -0.10 |
| 3 | Today daily open | 100.17 |
The pair is trading above its 20 Daily moving average @ 97.99, above its 50 Daily moving average @ 98.5 , above its 100 Daily moving average @ 98.35 and below its 200 Daily moving average @ 102.32
| Trends | Trends.1 | |
|---|---|---|
| 0 | Daily SMA20 | 97.99 |
| 1 | Daily SMA50 | 98.50 |
| 2 | Daily SMA100 | 98.35 |
| 3 | Daily SMA200 | 102.32 |
The previous day high was 100.6 while the previous day low was 100.03. The daily 38.2% Fib levels comes at 100.25, expected to provide resistance. Similarly, the daily 61.8% fib level is at 100.38, expected to provide resistance.
Note the levels of interest below:
- Pivot support is noted at 99.93, 99.7, 99.36
- Pivot resistance is noted at 100.5, 100.84, 101.07
| Levels | Levels.1 |
|---|---|
| Previous Daily High | 100.60 |
| Previous Daily Low | 100.03 |
| Previous Weekly High | 100.41 |
| Previous Weekly Low | 97.62 |
| Previous Monthly High | 100.64 |
| Previous Monthly Low | 94.07 |
| Daily Fibonacci 38.2% | 100.25 |
| Daily Fibonacci 61.8% | 100.38 |
| Daily Pivot Point S1 | 99.93 |
| Daily Pivot Point S2 | 99.70 |
| Daily Pivot Point S3 | 99.36 |
| Daily Pivot Point R1 | 100.50 |
| Daily Pivot Point R2 | 100.84 |
| Daily Pivot Point R3 | 101.07 |
[/s2If]
Join Our Telegram Group
")


