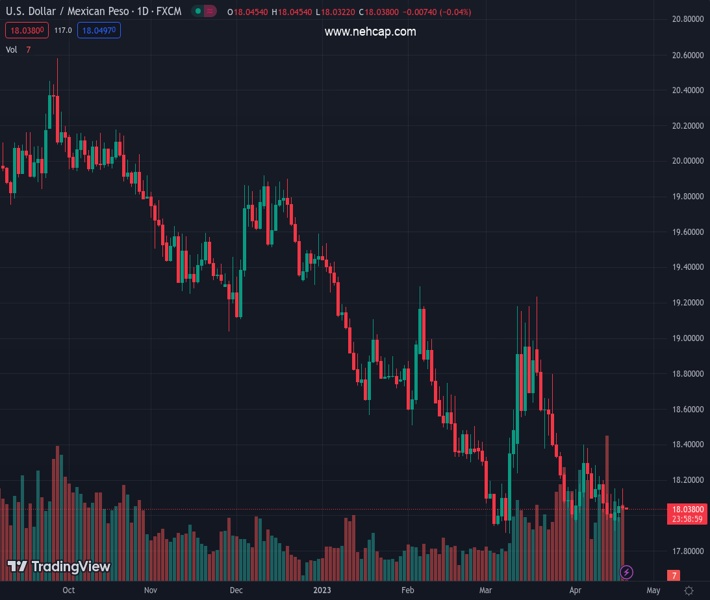
#USDMXN @ 18.0435 The US Federal Reserve Beige Book flashes that the economy in the US is slowing down, led by inflation, hiring, and consumption. (Pivot Orderbook analysis)
…
This is a premium post.
[s2If !current_user_can(access_s2member_level4)]Please register for PREMIUM VERSION HERE to read full post below containing analysis. In case of any error or you think you are not able to read the full post below, please email us at support#nehcap.com [lwa][/s2If] [s2If current_user_can(access_s2member_level4)]
- The US Federal Reserve Beige Book flashes that the economy in the US is slowing down, led by inflation, hiring, and consumption.
- Money market swaps suggest that the Federal Reserve will hike 25 bps hike and then pause, with investors eyeing a November cut.
- USD/MXN Price Analysis: Resumed its downtrend, with sellers eyeing a crack of 18.0000.
The pair currently trades last at 18.0435.
The previous day high was 18.0964 while the previous day low was 17.9639. The daily 38.2% Fib levels comes at 18.0458, expected to provide resistance. Similarly, the daily 61.8% fib level is at 18.0145, expected to provide support.
The USD/MXN retreats from weekly highs and the 20-day EMA, even though the market sentiment shifted sour, as shown by Wall Street closing mixed. Ebbs and flows stayed at the emerging market currency, although the US Dollar (USD) appreciated against most G7 currencies. At the time of writing, the USD/MXN is trading at 18.0440, sliding a tiny 0.04%.
Investors’ mood remained mixed throughout Wednesday’s session. The US Federal Reserve (Fed) revealed the Beige Book, which showed that the economy in the United States (US) is slowing while access to credit is narrowing. Delving into the book, hiring and inflation is slowing, price levels rose moderately, wages increased, and consumer spending “was generally seen as flat to down slightly.”
Given the backdrop, odds for a 25 bps rate hike, shown by the CME FedWatch Tool, remained at 86.7%, for the upcoming meeting, with traders expecting the Fed to stay put. Nevertheless, market players still expect the first rate cut by the November meeting.
Meanwhile, the greenback continued to rise, as shown by the US Dollar Index advancing 0.23%, up at 101.958, underpinned by high US bond yields. The 2-year note is yielding 4.248%, four and a half basis points higher than Tuesday’s close.
Even though some Federal Reserve officials have pushed back against a recession, the Beige Book put it on the table. However, inflation remains high, and before the May meeting, the US central bank would need to digest its preferred measure of inflation, the Core PCE for March.
On Tuesday, two Federal Reserve policymakers commented that inflation remains too high and the labor market too tight, namely St. Louis Fed President James Bullard and Atlanta’s Raphael Bostic. Regarding monetary policy, their views diverged, as Bostic favors one more hike and hold rates put, while Bullard expects an additional 50 bps of tightening to lift rates to the 5.50%-5.75% range.
There are growing speculations on the Mexican side of things that the Bank of Mexico (Banxico’s) may pause the tightening cycle. That has gained adepts as the latest inflation report showed a deceleration, putting Banxico at risk of overtightening conditions.
From a technical analysis perspective, the USD/MXN is still downward biased. However, the recent leg-up tested the 20-day Exponential Moving Average (EMA) at 18.1635 but failed to hold its ground and dropped towards the 18.0500 area. That said, the USD/MXN next support would be 18.0000, followed by the YTD low at 147.8968. Conversely, for a reversal, USD/MXN buyers must reclaim the 20-day EMA, with upside risks at the 50-day EMAT at 18.3749. Once cleared, the USD/MXN can rally towards the 100-day EMA At 18.6999.
Technical Levels: Supports and Resistances
USDMXN currently trading at 18.0504 at the time of writing. Pair opened at 18.0535 and is trading with a change of -0.02 % .
| Overview | Overview.1 | |
|---|---|---|
| 0 | Today last price | 18.0504 |
| 1 | Today Daily Change | -0.0031 |
| 2 | Today Daily Change % | -0.0200 |
| 3 | Today daily open | 18.0535 |
The pair remains strongly bearish on the daily time frame. It trades below the 20 SMA @ 18.1918, 50 SMA 18.3621, 100 SMA @ 18.8 and 200 SMA @ 19.3959.
| Trends | Trends.1 | |
|---|---|---|
| 0 | Daily SMA20 | 18.1918 |
| 1 | Daily SMA50 | 18.3621 |
| 2 | Daily SMA100 | 18.8000 |
| 3 | Daily SMA200 | 19.3959 |
The previous day high was 18.0964 while the previous day low was 17.9639. The daily 38.2% Fib levels comes at 18.0458, expected to provide resistance. Similarly, the daily 61.8% fib level is at 18.0145, expected to provide support.
Note the levels of interest below:
- Pivot support is noted at 17.9794, 17.9054, 17.8469
- Pivot resistance is noted at 18.1119, 18.1704, 18.2444
| Levels | Levels.1 |
|---|---|
| Previous Daily High | 18.0964 |
| Previous Daily Low | 17.9639 |
| Previous Weekly High | 18.2844 |
| Previous Weekly Low | 17.9753 |
| Previous Monthly High | 19.2324 |
| Previous Monthly Low | 17.8977 |
| Daily Fibonacci 38.2% | 18.0458 |
| Daily Fibonacci 61.8% | 18.0145 |
| Daily Pivot Point S1 | 17.9794 |
| Daily Pivot Point S2 | 17.9054 |
| Daily Pivot Point S3 | 17.8469 |
| Daily Pivot Point R1 | 18.1119 |
| Daily Pivot Point R2 | 18.1704 |
| Daily Pivot Point R3 | 18.2444 |
[/s2If]
Join Our Telegram Group
")


