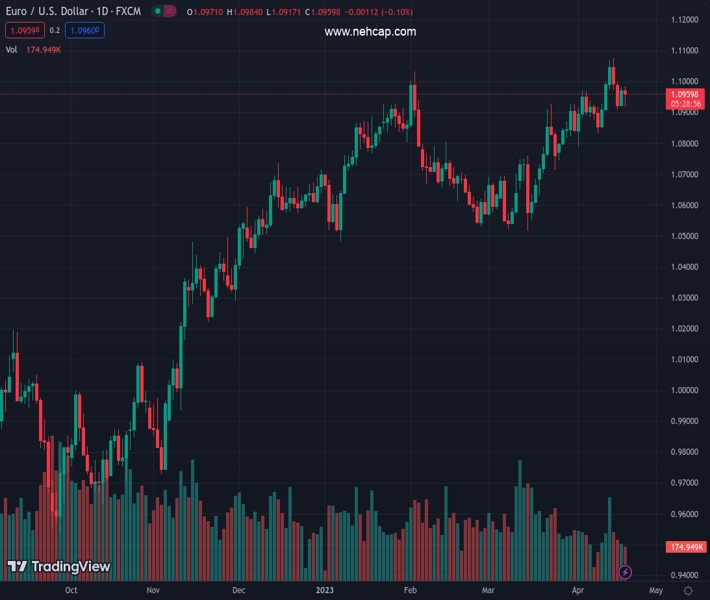
#EURUSD @ 1.09591 retraces, pressured by Fed’s hawkish comments and risk-off mood. (Pivot Orderbook analysis)
…
This is a premium post.
[s2If !current_user_can(access_s2member_level4)]Please register for PREMIUM VERSION HERE to read full post below containing analysis. In case of any error or you think you are not able to read the full post below, please email us at support#nehcap.com [lwa][/s2If] [s2If current_user_can(access_s2member_level4)]
- EUR/USD retraces, pressured by Fed’s hawkish comments and risk-off mood.
- US T-bond yield edge higher, bolstering the US Dollar.
- EU’s core inflation remains stickier, which could spur a reaction by the ECB.
The pair currently trades last at 1.09591.
The previous day high was 1.0983 while the previous day low was 1.0922. The daily 38.2% Fib levels comes at 1.096, expected to provide resistance. Similarly, the daily 61.8% fib level is at 1.0946, expected to provide support.
EUR/USD creeps lower in the mid-North American session as the financial markets are in a risk-off mode, expecting the next round of data that could rock the boat and give a clear direction to the pair. Inflation data in the Eurozone (EU) maintained the Euro (EUR) afloat, but high US Treasury bond yields cap the pair from reaching 1.1000. At the time of writing, the EUR/USD is trading at 1.0954, below its opening price by 0.15%.
Wall Street is trading with losses. US Treasury bond yields continued to edge higher, with the 2-year, the most sensitive to shifts in monetary policy, up six bps at 4.267%. The CME FedWatch Tool shows a chance of 84% for a 25 bps rate hike by the Fed at the upcoming May meeting, weighing on investors’ mood. The latest round of US Federal Reserve (Fed) officials led by St. Louis Fed President James Bullard and Atlanta’s Raphael Bostic commented that inflation is too high, the labor market too tight, and the economy is solid. Both said that a recession is not their base case scenario.
Regarding monetary policy, Bostic favors one more hike and a pause, while Bullard expects an additional 50 bps of tightening to lift rates to the 5.50%-5.75% range.
In the meantime, the US Dollar Index (DXY), which measures the performance of six currencies against the American Dollar (USD), roses 0.17%, at 101.881. Of note, the DXY has tested the 20-day EMA at 102.21 three times, meaning that demand has not been as strong to clear the latter, which could open the way toward 102.900.
On the EU front, March’s inflation in the bloc edged from 8.5% to 6.9% YoY as energy prices continued their downtrend. However, core inflation remains stubbornly stickier, following the global trend. The Core Harmonised Index of Consumer Prices (HICP) rose by 5.7% YoY, unchanged from the latest reading and the consensus, as European Central Bank (ECB) policymakers worried that high energy costs passed to the broader economy.
Given the backdrop, the EUR/USD could re-test the 1.1000 figure in the near term. ECB policymakers remained hawkish, as the Chief Economist Philip Lane commented that their baseline is to increase rates by 25 or 50 bps, which would depend on data.
From a daily chart perspective, the EUR/USD remains supported by the 20-day EMA from March 20 until today. As of writing, the 20-day EMA sits at 1.0896, and once the EUR/USD pair edged toward the moving average, it jumped and recorded a new cycle high. Should this be the case, the 1.1100 is up for grabs, but EUR buyers must reclaim the YTD high at 1.1075. Conversely, a fall below 1.0900 will expose the 20-day EMA at 1.0896. If EUR/USD drops below the latter, a dive to 1.0800 is on the cards.
Technical Levels: Supports and Resistances
EURUSD currently trading at 1.0955 at the time of writing. Pair opened at 1.0972 and is trading with a change of -0.15 % .
| Overview | Overview.1 | |
|---|---|---|
| 0 | Today last price | 1.0955 |
| 1 | Today Daily Change | -0.0017 |
| 2 | Today Daily Change % | -0.1500 |
| 3 | Today daily open | 1.0972 |
The pair remains strongly bullish on the daily timeframe. It trades above its 20 SMA @ 1.0898, 50 SMA 1.0751, 100 SMA @ 1.0722 and 200 SMA @ 1.0379.
| Trends | Trends.1 | |
|---|---|---|
| 0 | Daily SMA20 | 1.0898 |
| 1 | Daily SMA50 | 1.0751 |
| 2 | Daily SMA100 | 1.0722 |
| 3 | Daily SMA200 | 1.0379 |
The previous day high was 1.0983 while the previous day low was 1.0922. The daily 38.2% Fib levels comes at 1.096, expected to provide resistance. Similarly, the daily 61.8% fib level is at 1.0946, expected to provide support.
Note the levels of interest below:
- Pivot support is noted at 1.0935, 1.0899, 1.0875
- Pivot resistance is noted at 1.0996, 1.102, 1.1057
| Levels | Levels.1 |
|---|---|
| Previous Daily High | 1.0983 |
| Previous Daily Low | 1.0922 |
| Previous Weekly High | 1.1076 |
| Previous Weekly Low | 1.0837 |
| Previous Monthly High | 1.0930 |
| Previous Monthly Low | 1.0516 |
| Daily Fibonacci 38.2% | 1.0960 |
| Daily Fibonacci 61.8% | 1.0946 |
| Daily Pivot Point S1 | 1.0935 |
| Daily Pivot Point S2 | 1.0899 |
| Daily Pivot Point S3 | 1.0875 |
| Daily Pivot Point R1 | 1.0996 |
| Daily Pivot Point R2 | 1.1020 |
| Daily Pivot Point R3 | 1.1057 |
[/s2If]
Join Our Telegram Group
")


