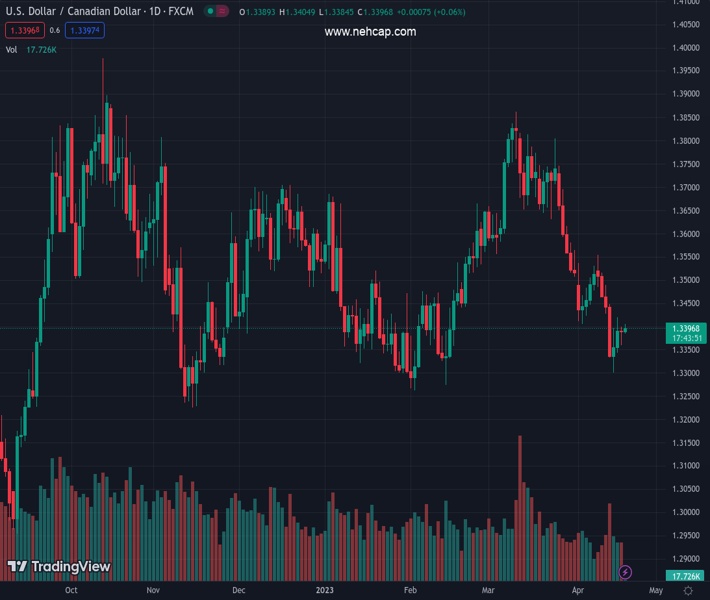
#USDCAD @ 1.33966 prints mild gains to reverse the previous day’s losses, grinds higher around the key upside hurdle., @nehcap view: Further upside expected (Pivot Orderbook analysis)
…
This is a premium post.
[s2If !current_user_can(access_s2member_level4)]Please register for PREMIUM VERSION HERE to read full post below containing analysis. In case of any error or you think you are not able to read the full post below, please email us at support#nehcap.com [lwa][/s2If] [s2If current_user_can(access_s2member_level4)]
- USD/CAD prints mild gains to reverse the previous day’s losses, grinds higher around the key upside hurdle.
- 200-DMA, three-week-old descending trend line and 23.6% Fibonacci retracement together highlight 1.3400 as the key resistance.
- Upward sloping trend line from early February restricts immediate downside amid nearly oversold RSI (14).
The pair currently trades last at 1.33966.
The previous day high was 1.34 while the previous day low was 1.336. The daily 38.2% Fib levels comes at 1.3375, expected to provide support. Similarly, the daily 61.8% fib level is at 1.3384, expected to provide support.
USD/CAD bulls jostle with the key upside hurdle around 1.3400 as they reverse the previous day’s pullback moves during a sluggish Wednesday morning in Europe. In doing so, the Loonie pair stays on the way to posting the weekly gains after falling heavily in the last week.
That said, a convergence of the 200-DMA, downward-sloping trend line from March 24 and 23.6% Fibonacci retracement level of the USD/CAD pair’s fall during October-November 2022 together highlight 1.3400 as the key upside hurdle.
Also challenging the bulls is the downbeat conditions of the RSI (14) even if the line’s nearness to the oversold territory prods bears.
Should the quote manages to successfully cross the 1.3400 hurdle, the odds of witnessing a fresh monthly high, currently around 1.3555, can’t be ruled out.
However, the 50% and 61.8% Fibonacci retracement levels, respectively near 1.3600 and 1.3695, will precede March’s peak of near 1.3865 to lure the USD/CAD buyers afterward.
Alternatively, pullback moves remain elusive unless the Loonie pair stays beyond an ascending support line from early February, close to 1.3330 by the press time.
Following that, a slump to the yearly low marked in February around 1.3260 can’t be ruled out.
Trend: Further upside expected
Technical Levels: Supports and Resistances
USDCAD currently trading at 1.3394 at the time of writing. Pair opened at 1.339 and is trading with a change of 0.03% % .
| Overview | Overview.1 | |
|---|---|---|
| 0 | Today last price | 1.3394 |
| 1 | Today Daily Change | 0.0004 |
| 2 | Today Daily Change % | 0.03% |
| 3 | Today daily open | 1.339 |
The pair remains strongly bearish on the daily time frame. It trades below the 20 SMA @ 1.3515, 50 SMA 1.3562, 100 SMA @ 1.3528 and 200 SMA @ 1.3405.
| Trends | Trends.1 | |
|---|---|---|
| 0 | Daily SMA20 | 1.3515 |
| 1 | Daily SMA50 | 1.3562 |
| 2 | Daily SMA100 | 1.3528 |
| 3 | Daily SMA200 | 1.3405 |
The previous day high was 1.34 while the previous day low was 1.336. The daily 38.2% Fib levels comes at 1.3375, expected to provide support. Similarly, the daily 61.8% fib level is at 1.3384, expected to provide support.
Note the levels of interest below:
- Pivot support is noted at 1.3367, 1.3343, 1.3327
- Pivot resistance is noted at 1.3406, 1.3423, 1.3446
| Levels | Levels.1 |
|---|---|
| Previous Daily High | 1.3400 |
| Previous Daily Low | 1.3360 |
| Previous Weekly High | 1.3554 |
| Previous Weekly Low | 1.3301 |
| Previous Monthly High | 1.3862 |
| Previous Monthly Low | 1.3508 |
| Daily Fibonacci 38.2% | 1.3375 |
| Daily Fibonacci 61.8% | 1.3384 |
| Daily Pivot Point S1 | 1.3367 |
| Daily Pivot Point S2 | 1.3343 |
| Daily Pivot Point S3 | 1.3327 |
| Daily Pivot Point R1 | 1.3406 |
| Daily Pivot Point R2 | 1.3423 |
| Daily Pivot Point R3 | 1.3446 |
[/s2If]
Join Our Telegram Group
")


