#XAUUSD @ 2,007.30 Gold price grinds higher after snapping two-day losing streak the previous day., @nehcap view: Further upside expected (Pivot Orderbook analysis)
…
This is a premium post.
[s2If !current_user_can(access_s2member_level4)]Please register for PREMIUM VERSION HERE to read full post below containing analysis. In case of any error or you think you are not able to read the full post below, please email us at support#nehcap.com [lwa][/s2If] [s2If current_user_can(access_s2member_level4)]
- Gold price grinds higher after snapping two-day losing streak the previous day.
- Softer United States data contrasts with upbeat China statistics to underpin XAU/USD rebound.
- US Treasury bond yields, US Dollar bear the burden of downbeat data, anxiety ahead of United States debt ceiling plan.
- Gold buyers need support of risk-on mood to refresh YTD high.
The pair currently trades last at 2007.30.
The previous day high was 2011.9 while the previous day low was 1991.32. The daily 38.2% Fib levels comes at 2004.04, expected to provide support. Similarly, the daily 61.8% fib level is at 1999.18, expected to provide support.
Gold price (XAU/USD) stays defensive around $2,005 amid sluggish Wednesday morning in Asia. In doing so, the XAU/USD bulls reassess the latest catalysts that helped the Gold price snap a two-day downtrend as market sentiment dwindles due to mixed signals and a cautious mood ahead of an important event. Even so, downbeat US Dollar and United States Treasury bond yields put a floor under the commodity’s price.
Gold price managed to post the first daily gains in three as downbeat United States Treasury bond yields joined the US Dollar weakness amid softer US data. That said, the US Dollar Index (DXY) reverses the previous rebound from a one-year low while printing the second daily loss in four. The greenback’s gauge versus six major currencies tracks downbeat yields to take a U-turn the previous day. That said, the US 10-year and two-year Treasury bond coupons dropped for the first time in four days by the end of Tuesday, sluggish around 3.59% and 4.21% by the press time.
Talking about the United States data, the US Housing Starts and Building Permits roiled the mood with downbeat prints for March on Tuesday. That said, the Housing Starts eased to 1.42M versus 1.432M prior and 1.40M market forecasts whereas the Building Permits dropped to 1.413M from 1.55M previous readings and analysts’ estimations of 2.2M. It’s worth noting that the NY Empire State Manufacturing Index and the US National Association of Home Builders (NAHB) housing market index marked upbeat prints on Monday and allowed the US Dollar buyers to remain firmer.
On the contrary, comments from the Federal Reserve (Fed) Officials have been hawkish of late. On Tuesday, St. Louis Federal Reserve President James Bullard said, in an interview with Reuters, “Interest rates will need to continue to rise in the absence of clear progress on inflation.” On Monday, Richmond Fed President Thomas Barkin said that he wants to see more evidence of inflation settling back to target. Recently, Atlanta Fed President Raphael W. Bostic who recently mentioned that the economy is still gaining momentum, but inflation is too high.
Hence, the downbeat US data supersedes the hawkish Fed talks and propel the Gold price.
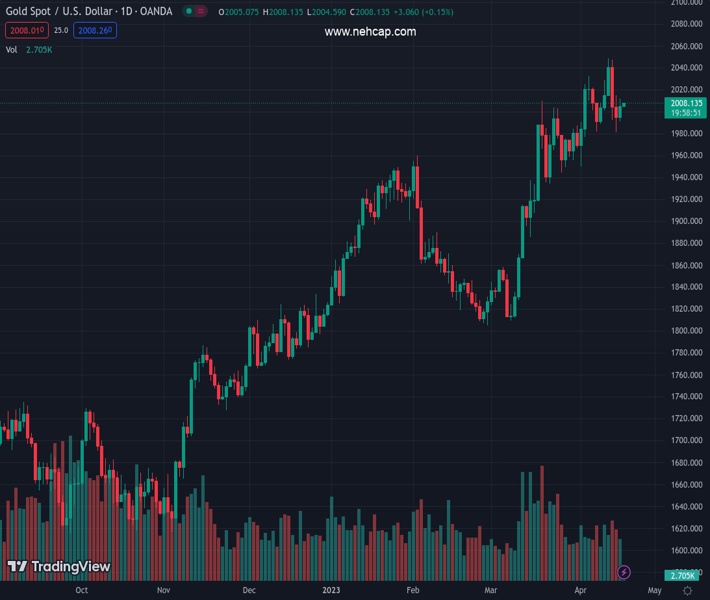
Gold price remains firmer inside a one-month-old ascending trend channel, recently bouncing off the 100-bar Simple Moving Average (SMA).
In addition to the bullish chart formation, the looming bull cross on the Moving Average Convergence and Divergence (MACD) indicator, as well as the upward-sloping Relative Strength Index (RSI) line, placed at 14, also keeps XAU/USD buyers hopeful.
However, multiple hurdles around $2,030 and the aforementioned channel’s top line, close to $2,053 by the press time, could challenge the Gold price upside ahead of directing the bulls towards the previous yearly top of $2,070.
Following that, the record top of $2,075, marked in 2020, will be in the spotlight.
Meanwhile, the 100-SMA and bottom line of the stated channel, close to $1,993 and $1,982 in that order, restrict short-term Gold price downside ahead of the 200-SMA support of near $1,947.
It should be noted that the XAU/USD’s weakness past 200-SMA makes it vulnerable to drop toward the previous monthly low, around $1,809.
Trend: Further upside expected
Technical Levels: Supports and Resistances
XAUUSD currently trading at 2005.37 at the time of writing. Pair opened at 2005.42 and is trading with a change of -0.00% % .
| Overview | Overview.1 | |
|---|---|---|
| 0 | Today last price | 2005.37 |
| 1 | Today Daily Change | -0.05 |
| 2 | Today Daily Change % | -0.00% |
| 3 | Today daily open | 2005.42 |
The pair remains strongly bullish on the daily timeframe. It trades above its 20 SMA @ 1990.71, 50 SMA 1912.38, 100 SMA @ 1880.5 and 200 SMA @ 1796.32.
| Trends | Trends.1 | |
|---|---|---|
| 0 | Daily SMA20 | 1990.71 |
| 1 | Daily SMA50 | 1912.38 |
| 2 | Daily SMA100 | 1880.50 |
| 3 | Daily SMA200 | 1796.32 |
The previous day high was 2011.9 while the previous day low was 1991.32. The daily 38.2% Fib levels comes at 2004.04, expected to provide support. Similarly, the daily 61.8% fib level is at 1999.18, expected to provide support.
Note the levels of interest below:
- Pivot support is noted at 1993.86, 1982.3, 1973.28
- Pivot resistance is noted at 2014.44, 2023.46, 2035.02
| Levels | Levels.1 |
|---|---|
| Previous Daily High | 2011.90 |
| Previous Daily Low | 1991.32 |
| Previous Weekly High | 2048.75 |
| Previous Weekly Low | 1986.28 |
| Previous Monthly High | 2009.88 |
| Previous Monthly Low | 1809.46 |
| Daily Fibonacci 38.2% | 2004.04 |
| Daily Fibonacci 61.8% | 1999.18 |
| Daily Pivot Point S1 | 1993.86 |
| Daily Pivot Point S2 | 1982.30 |
| Daily Pivot Point S3 | 1973.28 |
| Daily Pivot Point R1 | 2014.44 |
| Daily Pivot Point R2 | 2023.46 |
| Daily Pivot Point R3 | 2035.02 |
[/s2If]
Join Our Telegram Group
")


