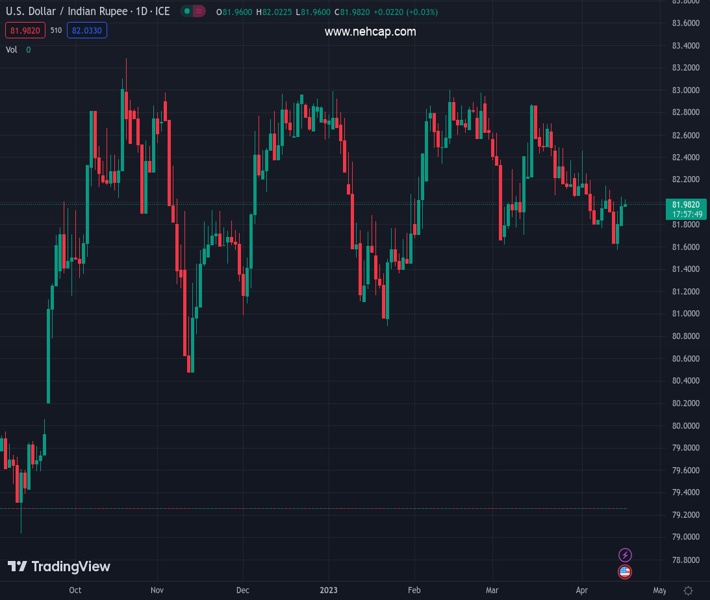
#USDINR @ 81.9950 struggles to extend two-day rebound from the lowest levels in 11 weeks., @nehcap view: Further upside expected (Pivot Orderbook analysis)
…
This is a premium post.
[s2If !current_user_can(access_s2member_level4)]Please register for PREMIUM VERSION HERE to read full post below containing analysis. In case of any error or you think you are not able to read the full post below, please email us at support#nehcap.com [lwa][/s2If] [s2If current_user_can(access_s2member_level4)]
- USD/INR struggles to extend two-day rebound from the lowest levels in 11 weeks.
- One-month-old descending resistance line, 200-SMA challenge Indian Rupee sellers.
- Multiple bottoms around 81.50, bullish MACD signals keep pair buyers hopeful.
The pair currently trades last at 81.9950.
The previous day high was 82.0965 while the previous day low was 81.845. The daily 38.2% Fib levels comes at 82.0005, expected to provide resistance. Similarly, the daily 61.8% fib level is at 81.9411, expected to provide support.
USD/INR bulls prod the short-term key hurdles while trying to defend the latest recovery from a multi-day low during early Tuesday. In doing so, the Indian Rupee (INR) pair grinds higher around the 82.00 threshold after rising in the last two consecutive days.
It’s worth noting that the USD/INR pair’s multiple rebounds from the 81.50 horizontal support, stretched since early February, join bullish MACD signals to keep buyers hopeful.
However, a clear upside break of a downward-sloping resistance line from March 15 and the 200-SMA, respectively near 82.05 and 82.15, becomes necessary for the USD/INR bulls to keep the reins.
Following that, the monthly high of around 82.50 may challenge the pair buyers before directing them to the multi-day resistance area surrounding the 83.00 round figure.
Meanwhile, pullback moves may initially aim for the early April lows surrounding 81.75 before challenging the aforementioned horizontal support around 81.50. Also acting as a downside filter is the late January swing low around 81.35.
In a case where USD/INR bears keep the reins past 81.35, the odds of witnessing a slump toward the yearly low marked in January around 80.88 will be in focus.
Overall, USD/INR remains on the bull’s radar unless breaking 81.35. However, the pair’s road to the north appears long and bumpy.
Trend: Further upside expected
Technical Levels: Supports and Resistances
USDINR currently trading at 82.012 at the time of writing. Pair opened at 82 and is trading with a change of 0.01% % .
| Overview | Overview.1 | |
|---|---|---|
| 0 | Today last price | 82.012 |
| 1 | Today Daily Change | 0.0120 |
| 2 | Today Daily Change % | 0.01% |
| 3 | Today daily open | 82 |
The pair is trading below its 20 Daily moving average @ 82.1075, below its 50 Daily moving average @ 82.3449 , below its 100 Daily moving average @ 82.2225 and above its 200 Daily moving average @ 81.4769
| Trends | Trends.1 | |
|---|---|---|
| 0 | Daily SMA20 | 82.1075 |
| 1 | Daily SMA50 | 82.3449 |
| 2 | Daily SMA100 | 82.2225 |
| 3 | Daily SMA200 | 81.4769 |
The previous day high was 82.0965 while the previous day low was 81.845. The daily 38.2% Fib levels comes at 82.0005, expected to provide resistance. Similarly, the daily 61.8% fib level is at 81.9411, expected to provide support.
Note the levels of interest below:
- Pivot support is noted at 81.8645, 81.729, 81.613
- Pivot resistance is noted at 82.116, 82.232, 82.3675
| Levels | Levels.1 |
|---|---|
| Previous Daily High | 82.0965 |
| Previous Daily Low | 81.8450 |
| Previous Weekly High | 82.1600 |
| Previous Weekly Low | 81.5105 |
| Previous Monthly High | 83.0315 |
| Previous Monthly Low | 81.5120 |
| Daily Fibonacci 38.2% | 82.0005 |
| Daily Fibonacci 61.8% | 81.9411 |
| Daily Pivot Point S1 | 81.8645 |
| Daily Pivot Point S2 | 81.7290 |
| Daily Pivot Point S3 | 81.6130 |
| Daily Pivot Point R1 | 82.1160 |
| Daily Pivot Point R2 | 82.2320 |
| Daily Pivot Point R3 | 82.3675 |
[/s2If]
Join Our Telegram Group
")


