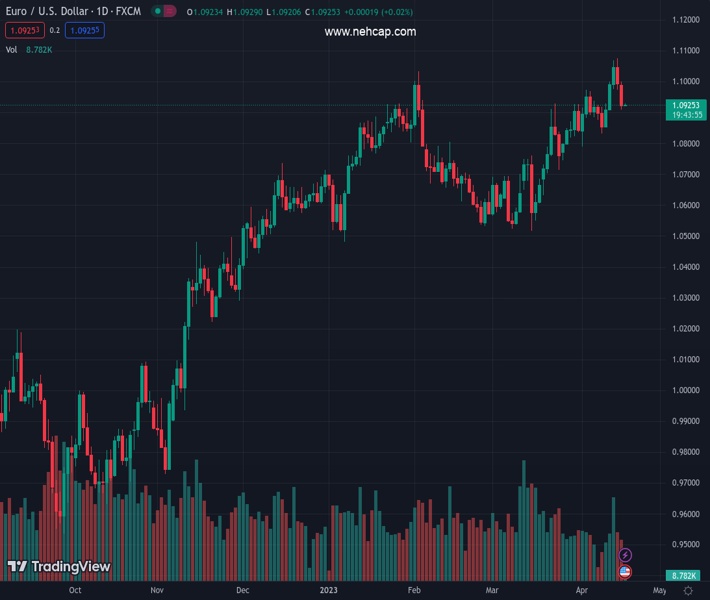
#EURUSD @ 1.09264 is showing a sideways move around 1.0926 following the footprints of the USD Index. (Pivot Orderbook analysis)
…
This is a premium post.
[s2If !current_user_can(access_s2member_level4)]Please register for PREMIUM VERSION HERE to read full post below containing analysis. In case of any error or you think you are not able to read the full post below, please email us at support#nehcap.com [lwa][/s2If] [s2If current_user_can(access_s2member_level4)]
- EUR/USD is showing a sideways move around 1.0926 following the footprints of the USD Index.
- ECB policymakers are divided over the scale of the interest rate hike to be announced in May.
- The major currency pair has dropped below the upward-sloping trendline plotted from 1.0714.
The pair currently trades last at 1.09264.
The previous day high was 1.1 while the previous day low was 1.0909. The daily 38.2% Fib levels comes at 1.0944, expected to provide resistance. Similarly, the daily 61.8% fib level is at 1.0965, expected to provide resistance.
The EUR/USD pair is displaying topsy-turvy moves in a narrow range around 1.0926 in the Asian session. The major currency pair is struggling to find a direction following the footprints of the sideways US Dollar Index (DXY).
S&P500 futures are showing nominal losses in Asia as investors are worried about the upcoming quarterly result season, portraying a minor decline in the risk appetite of the market participants. Investors are worried about any holes in banking quarterly reports after the collapse of United States regional banks.
The Euro has got inside the woods as European Central Bank (ECB) policymakers are divided over the pace of the policy-tightening spell to be adopted in May’s monetary policy meeting. ECB policymaker Martins Kazaks said on Monday, the central bank has the option of 25 basis points (bps) or 50 bps move in May.
On a two-hour scale, EUR/USD witnessed a steep fall after failing to sustain above the 161.8% Fibonacci Extension (placed from April 04 high at 1.0973 to April 10 low at 1.0837) at 1.1057. The major currency pair has dropped below the upward-sloping trendline plotted from March 24 low at 1.0714.
The 20-period Exponential Moving Average (EMA) at 1.0962 is acting as a barrier for the Euro bulls.
Meanwhile, the Relative Strength Index (RSI) (14) has shifted into the bearish range of 20.00-40.00, advocating more weakness ahead.
A decisive break below April 12 low at 1.0915 will drag the asset towards April 10 low at 1.0837 and April 03 low at 1.0788.
On the flip side, a break above the psychological resistance of 1.1000 will drive the asset to a fresh annual high at 1.1068, followed by the round-level resistance at 1.1100.
Technical Levels: Supports and Resistances
EURUSD currently trading at 1.0925 at the time of writing. Pair opened at 1.0925 and is trading with a change of 0.0 % .
| Overview | Overview.1 | |
|---|---|---|
| 0 | Today last price | 1.0925 |
| 1 | Today Daily Change | 0.0000 |
| 2 | Today Daily Change % | 0.0000 |
| 3 | Today daily open | 1.0925 |
The pair remains strongly bullish on the daily timeframe. It trades above its 20 SMA @ 1.0888, 50 SMA 1.0747, 100 SMA @ 1.0716 and 200 SMA @ 1.0375.
| Trends | Trends.1 | |
|---|---|---|
| 0 | Daily SMA20 | 1.0888 |
| 1 | Daily SMA50 | 1.0747 |
| 2 | Daily SMA100 | 1.0716 |
| 3 | Daily SMA200 | 1.0375 |
The previous day high was 1.1 while the previous day low was 1.0909. The daily 38.2% Fib levels comes at 1.0944, expected to provide resistance. Similarly, the daily 61.8% fib level is at 1.0965, expected to provide resistance.
Note the levels of interest below:
- Pivot support is noted at 1.089, 1.0854, 1.0799
- Pivot resistance is noted at 1.098, 1.1035, 1.1071
| Levels | Levels.1 |
|---|---|
| Previous Daily High | 1.1000 |
| Previous Daily Low | 1.0909 |
| Previous Weekly High | 1.1076 |
| Previous Weekly Low | 1.0837 |
| Previous Monthly High | 1.0930 |
| Previous Monthly Low | 1.0516 |
| Daily Fibonacci 38.2% | 1.0944 |
| Daily Fibonacci 61.8% | 1.0965 |
| Daily Pivot Point S1 | 1.0890 |
| Daily Pivot Point S2 | 1.0854 |
| Daily Pivot Point S3 | 1.0799 |
| Daily Pivot Point R1 | 1.0980 |
| Daily Pivot Point R2 | 1.1035 |
| Daily Pivot Point R3 | 1.1071 |
[/s2If]
Join Our Telegram Group
")


