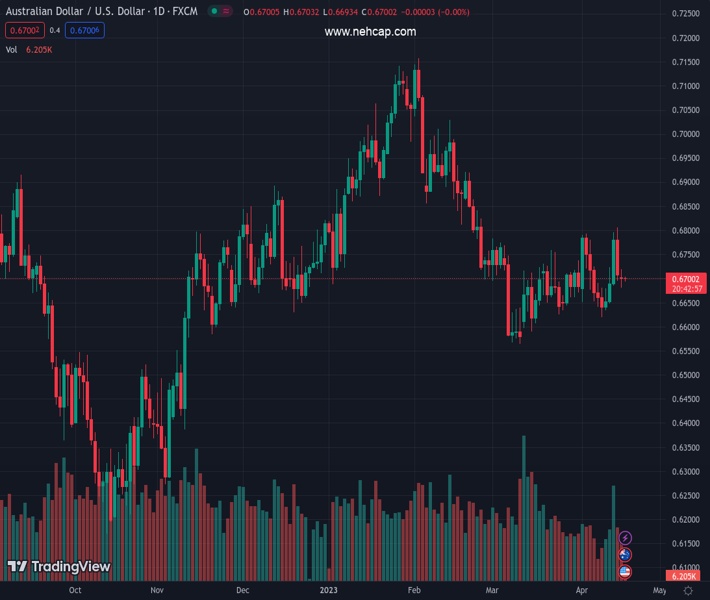
#AUDUSD @ 0.66997 remains indecisive after falling in the last two consecutive days., @nehcap view: Further downside expected (Pivot Orderbook analysis)
…
This is a premium post.
[s2If !current_user_can(access_s2member_level4)]Please register for PREMIUM VERSION HERE to read full post below containing analysis. In case of any error or you think you are not able to read the full post below, please email us at support#nehcap.com [lwa][/s2If] [s2If current_user_can(access_s2member_level4)]
- AUD/USD remains indecisive after falling in the last two consecutive days.
- 21-SMA, 200-SMA restrict immediate trading moves ahead of a broad channel formation.
- Bearish MACD signals, steady RSI suggests conditions of slower grind towards the south.
The pair currently trades last at 0.66997.
The previous day high was 0.6806 while the previous day low was 0.6695. The daily 38.2% Fib levels comes at 0.6738, expected to provide resistance. Similarly, the daily 61.8% fib level is at 0.6764, expected to provide resistance.
AUD/USD portrays pre-data anxiety as it seesaws around the 0.6700 round figure, between the 21-SMA and 200-SMA, ahead of the Monetary Policy Meeting Minutes from the Reserve Bank of Australia (RBA) and China’s first quarter (Q1) Gross Domestic Product (GDP) data. Even so, the Aussie pair remains on the bear’s radar during early Tuesday, after declining in the last two consecutive days.
Also read: AUD/USD Forecast: Points to consolidation around 0.6700 if the Dollar permits
Bearish MACD signals and a steady RSI (14) line hint at the continuation of the AUD/USD pair’s downward trajectory. However, the 21-SMA and 200-SMA, respectively near 0.6730 and 0.6685, restrict the Aussie pair’s immediate moves ahead of the key catalysts.
Should the AUD/USD pair crosses the aforementioned SMA region, a wider trading range comprising an upward-sloping resistance line from March, between 0.6800 and 0.6630, becomes the key for the pair traders to watch for clear directions.
In a case where the downbeat data and dovish RBA Minutes direct the Aussie pair past 0.6630, the odds of witnessing the AUD/USD pair’s fall towards the previous monthly low of around 0.6565 can’t be ruled out.
Overall, AUD/USD remains on the back foot despite the latest inaction. However, a clear break of 0.6630 becomes necessary to confirm the bearish trend.
Trend: Further downside expected
Technical Levels: Supports and Resistances
AUDUSD currently trading at 0.67 at the time of writing. Pair opened at 0.6704 and is trading with a change of -0.06% % .
| Overview | Overview.1 | |
|---|---|---|
| 0 | Today last price | 0.67 |
| 1 | Today Daily Change | -0.0004 |
| 2 | Today Daily Change % | -0.06% |
| 3 | Today daily open | 0.6704 |
The pair is trading above its 20 Daily moving average @ 0.6696, below its 50 Daily moving average @ 0.6748 , below its 100 Daily moving average @ 0.68 and below its 200 Daily moving average @ 0.6744
| Trends | Trends.1 | |
|---|---|---|
| 0 | Daily SMA20 | 0.6696 |
| 1 | Daily SMA50 | 0.6748 |
| 2 | Daily SMA100 | 0.6800 |
| 3 | Daily SMA200 | 0.6744 |
The previous day high was 0.6806 while the previous day low was 0.6695. The daily 38.2% Fib levels comes at 0.6738, expected to provide resistance. Similarly, the daily 61.8% fib level is at 0.6764, expected to provide resistance.
Note the levels of interest below:
- Pivot support is noted at 0.6664, 0.6624, 0.6552
- Pivot resistance is noted at 0.6775, 0.6846, 0.6886
| Levels | Levels.1 |
|---|---|
| Previous Daily High | 0.6806 |
| Previous Daily Low | 0.6695 |
| Previous Weekly High | 0.6806 |
| Previous Weekly Low | 0.6620 |
| Previous Monthly High | 0.6784 |
| Previous Monthly Low | 0.6564 |
| Daily Fibonacci 38.2% | 0.6738 |
| Daily Fibonacci 61.8% | 0.6764 |
| Daily Pivot Point S1 | 0.6664 |
| Daily Pivot Point S2 | 0.6624 |
| Daily Pivot Point S3 | 0.6552 |
| Daily Pivot Point R1 | 0.6775 |
| Daily Pivot Point R2 | 0.6846 |
| Daily Pivot Point R3 | 0.6886 |
[/s2If]
Join Our Telegram Group
")


