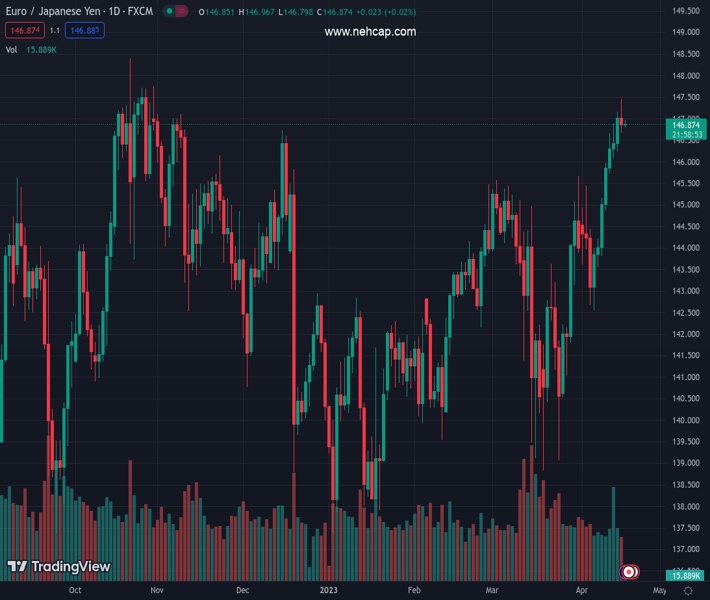
#EURJPY @ 146.873 is still upward biased, but failure at 147.00 exacerbated a pullback towards 146.80s. (Pivot Orderbook analysis)
…
This is a premium post.
[s2If !current_user_can(access_s2member_level4)]Please register for PREMIUM VERSION HERE to read full post below containing analysis. In case of any error or you think you are not able to read the full post below, please email us at support#nehcap.com [lwa][/s2If] [s2If current_user_can(access_s2member_level4)]
- EUR/JPY is still upward biased, but failure at 147.00 exacerbated a pullback towards 146.80s.
- Downside risks for the EUR/JPY remain at 146.60 as sellers will eye the 20-DMA.
- A bullish resumption will occur if EUR/JPY reclaims 147.00.
The pair currently trades last at 146.873.
The previous day high was 147.16 while the previous day low was 146.24. The daily 38.2% Fib levels comes at 146.81, expected to provide support. Similarly, the daily 61.8% fib level is at 146.59, expected to provide support.
The EUR/JPY hit a YTD high at 147.45 but retreated and lost 0.11% in Monday’s trading session. However, as the Asian session begins, the EUR/JPY starts to trend higher, exchanging hands at 146.93, above 0.06%.
Monday’s price action formed an inverted hammer that could be a prelude of an evening star, a three-candlestick bearish pattern that could pave the way for further downside. Nevertheless, to confirm its validity, the EUR/JPY must break below the April 17 daily low of 146.66, followed by 146.50, before testing the April 14 low at 146.24.
The Relative Strength Index (RSI) shifted flat but remained bullish. Contrarily, the Rate of Change (RoC), shows that buying pressure is waning as it heads to neutral territory.
For a bearish continuation, if EUR/JPY cracks 146.24, it needs to break below 146.00. Once done, the pair might dive toward the December 20 daily high at 145.83 before retreating toward the 20-day Exponential Moving Average (EMA) at 144.87.
On the flip side, for a bullish continuation, the EUR/JPY must reclaim 147.00, which would open the door to test the YTD high at 147.45, followed by the 148.00 figure.
Technical Levels: Supports and Resistances
EURJPY currently trading at 146.92 at the time of writing. Pair opened at 146.97 and is trading with a change of -0.03 % .
| Overview | Overview.1 | |
|---|---|---|
| 0 | Today last price | 146.92 |
| 1 | Today Daily Change | -0.05 |
| 2 | Today Daily Change % | -0.03 |
| 3 | Today daily open | 146.97 |
The pair remains strongly bullish on the daily timeframe. It trades above its 20 SMA @ 143.78, 50 SMA 143.36, 100 SMA @ 142.56 and 200 SMA @ 142.06.
| Trends | Trends.1 | |
|---|---|---|
| 0 | Daily SMA20 | 143.78 |
| 1 | Daily SMA50 | 143.36 |
| 2 | Daily SMA100 | 142.56 |
| 3 | Daily SMA200 | 142.06 |
The previous day high was 147.16 while the previous day low was 146.24. The daily 38.2% Fib levels comes at 146.81, expected to provide support. Similarly, the daily 61.8% fib level is at 146.59, expected to provide support.
Note the levels of interest below:
- Pivot support is noted at 146.42, 145.87, 145.5
- Pivot resistance is noted at 147.34, 147.71, 148.25
| Levels | Levels.1 |
|---|---|
| Previous Daily High | 147.16 |
| Previous Daily Low | 146.24 |
| Previous Weekly High | 147.16 |
| Previous Weekly Low | 143.80 |
| Previous Monthly High | 145.67 |
| Previous Monthly Low | 138.83 |
| Daily Fibonacci 38.2% | 146.81 |
| Daily Fibonacci 61.8% | 146.59 |
| Daily Pivot Point S1 | 146.42 |
| Daily Pivot Point S2 | 145.87 |
| Daily Pivot Point S3 | 145.50 |
| Daily Pivot Point R1 | 147.34 |
| Daily Pivot Point R2 | 147.71 |
| Daily Pivot Point R3 | 148.25 |
[/s2If]
Join Our Telegram Group
")


