#NZDUSD @ 0.61718 US Dollar remains strong, DXY gains 0.45%. (Pivot Orderbook analysis)
…
This is a premium post.
[s2If !current_user_can(access_s2member_level4)]Please register for PREMIUM VERSION HERE to read full post below containing analysis. In case of any error or you think you are not able to read the full post below, please email us at support#nehcap.com [lwa][/s2If] [s2If current_user_can(access_s2member_level4)]
- US Dollar remains strong, DXY gains 0.45%.
- US Empire Manufacturing jumps in March.
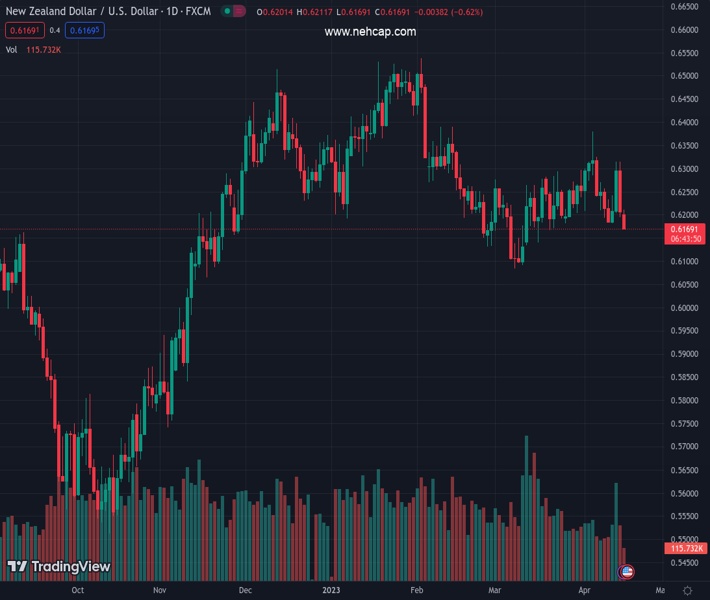
- NZD/USD breaks previous lows, looks at the 200-day SMA.
The pair currently trades last at 0.61718.
The previous day high was 0.6315 while the previous day low was 0.6195. The daily 38.2% Fib levels comes at 0.6241, expected to provide resistance. Similarly, the daily 61.8% fib level is at 0.6269, expected to provide resistance.
The NZD/USD is falling for the second day in a row and printed fresh lows after the release of US data, hitting at 0.6175, the lowest in four weeks. The US Dollar gained momentum across the board and resumed the upside.
Data released on Monday showed an unexpected rebound from -24.60 to 10.8, against expectations of -18.0. The numbers boosted further the US Dollar while the Kiwi is lagging again.
Earlier on Monday, data from New Zealand showed a 0.8% increase in the Food Price Index during March and a modest decline in the Business NZ PSI in March to 54.4 from 55.8. The key report this week in New Zealand will be Q1 inflation early on Thursday.
NZD/USD is trading at 0.6175, at the lowest level since March 22. The pair is holding below previous April lows, looking vulnerable, near the 200-day Simple Moving Average that stands at 0.6160.
Technical Levels: Supports and Resistances
NZDUSD currently trading at 0.6184 at the time of writing. Pair opened at 0.6205 and is trading with a change of -0.34 % .
| Overview | Overview.1 | |
|---|---|---|
| 0 | Today last price | 0.6184 |
| 1 | Today Daily Change | -0.0021 |
| 2 | Today Daily Change % | -0.3400 |
| 3 | Today daily open | 0.6205 |
The pair is trading below its 20 Daily moving average @ 0.6245, below its 50 Daily moving average @ 0.6237 , below its 100 Daily moving average @ 0.6303 and above its 200 Daily moving average @ 0.6161
| Trends | Trends.1 | |
|---|---|---|
| 0 | Daily SMA20 | 0.6245 |
| 1 | Daily SMA50 | 0.6237 |
| 2 | Daily SMA100 | 0.6303 |
| 3 | Daily SMA200 | 0.6161 |
The previous day high was 0.6315 while the previous day low was 0.6195. The daily 38.2% Fib levels comes at 0.6241, expected to provide resistance. Similarly, the daily 61.8% fib level is at 0.6269, expected to provide resistance.
Note the levels of interest below:
- Pivot support is noted at 0.6162, 0.6118, 0.6042
- Pivot resistance is noted at 0.6282, 0.6358, 0.6402
| Levels | Levels.1 |
|---|---|
| Previous Daily High | 0.6315 |
| Previous Daily Low | 0.6195 |
| Previous Weekly High | 0.6316 |
| Previous Weekly Low | 0.6169 |
| Previous Monthly High | 0.6298 |
| Previous Monthly Low | 0.6084 |
| Daily Fibonacci 38.2% | 0.6241 |
| Daily Fibonacci 61.8% | 0.6269 |
| Daily Pivot Point S1 | 0.6162 |
| Daily Pivot Point S2 | 0.6118 |
| Daily Pivot Point S3 | 0.6042 |
| Daily Pivot Point R1 | 0.6282 |
| Daily Pivot Point R2 | 0.6358 |
| Daily Pivot Point R3 | 0.6402 |
[/s2If]
Join Our Telegram Group
")


