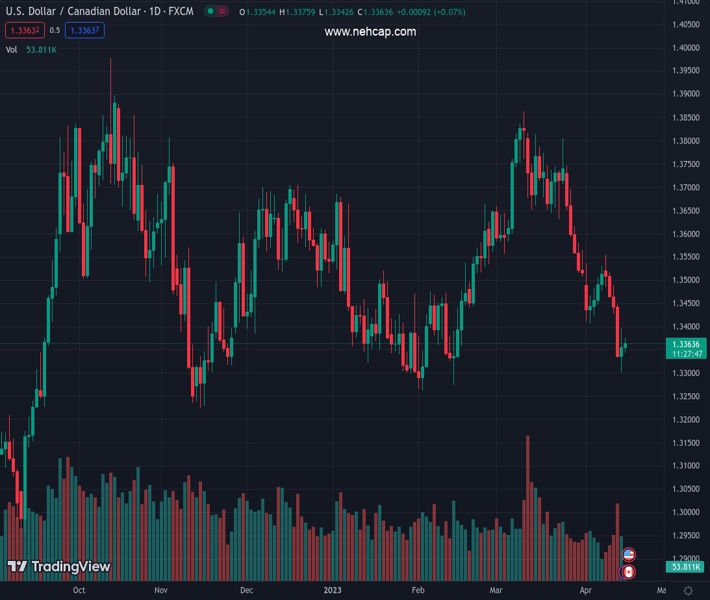
#USDCAD @ 1.33627 attracts some dip-buying on the first day of a new week, though lacks follow-through. (Pivot Orderbook analysis)
…
This is a premium post.
[s2If !current_user_can(access_s2member_level4)]Please register for PREMIUM VERSION HERE to read full post below containing analysis. In case of any error or you think you are not able to read the full post below, please email us at support#nehcap.com [lwa][/s2If] [s2If current_user_can(access_s2member_level4)]
- USD/CAD attracts some dip-buying on the first day of a new week, though lacks follow-through.
- Softer Crude Oil prices undermine the Loonie and lend some support amid a modest USD uptick.
- Expectations for an imminent Fed rate hike pause act as a headwind for the USD and cap gains.
The pair currently trades last at 1.33627.
The previous day high was 1.3396 while the previous day low was 1.3301. The daily 38.2% Fib levels comes at 1.336, expected to provide support. Similarly, the daily 61.8% fib level is at 1.3337, expected to provide support.
The USD/CAD pair reverses an intraday dip to the 1.3340 area on Monday and climbs to the top end of its daily trading range during the first half of the European session. The pair, however, remains confined well within Friday’s broader trading range, below a technically significant 200-day Simple Moving Average (SMA) and is currently placed around the 1.3365-1.3370 region.
The US Dollar (USD) edges higher for the second successive day and moves away from a one-year low touched on Friday. Apart from this, a modest downtick in Crude Oil prices is seen undermining the commodity-linked Loonie and acting as a tailwind for the USD/CAD pair. The University of Michigan’s preliminary report showed that one-year inflation expectations rose to 4.6% in April from 3.6% previous and fueled speculations that the Federal Reserve (Fed) might continue raising interest rates.
Adding to this, hawkish comments by Fed officials reaffirmed market expectations for another 25 bps lift-off at the next FOMC meeting in May. This, in turn, remains supportive of elevated US Treasury bond yields and continues to lend some support to the Greenback. That said, growing acceptance that the Fed will pause its rate-hiking cycle, sooner rather than later, amid signs of easing inflationary pressures, holds back the USD bulls from placing aggressive bets and seems to cap the USD/CAD pair.
The US CPI and the PPI report released last week indicated that disinflation is progressing smoothly. Moreover, the mostly downbeat US Retail Sales figures on Friday reaffirmed the view that the Fed’s year-long interest rate hiking campaign is cooling domestic demand. This makes it prudent to wait for strong follow-through buying before confirming that the USD/CAD pair has formed a near-term bottom near the 1.3300 mark, or a two-month low set on Friday, and positioning for further gains.
Market participants now look to the US economic docket, featuring the release of the Empire State Manufacturing Index later during the early North American session. Apart from this, the US bond yields, along with the broader risk sentiment, will drive the USD demand and provide some impetus to the USD/CAD pair. Traders will further take cues from Oil price dynamics to grab short-term opportunities.
Technical Levels: Supports and Resistances
USDCAD currently trading at 1.3366 at the time of writing. Pair opened at 1.3371 and is trading with a change of -0.04 % .
| Overview | Overview.1 | |
|---|---|---|
| 0 | Today last price | 1.3366 |
| 1 | Today Daily Change | -0.0005 |
| 2 | Today Daily Change % | -0.0400 |
| 3 | Today daily open | 1.3371 |
The pair remains strongly bearish on the daily time frame. It trades below the 20 SMA @ 1.3545, 50 SMA 1.3563, 100 SMA @ 1.3531 and 200 SMA @ 1.3401.
| Trends | Trends.1 | |
|---|---|---|
| 0 | Daily SMA20 | 1.3545 |
| 1 | Daily SMA50 | 1.3563 |
| 2 | Daily SMA100 | 1.3531 |
| 3 | Daily SMA200 | 1.3401 |
The previous day high was 1.3396 while the previous day low was 1.3301. The daily 38.2% Fib levels comes at 1.336, expected to provide support. Similarly, the daily 61.8% fib level is at 1.3337, expected to provide support.
Note the levels of interest below:
- Pivot support is noted at 1.3316, 1.3262, 1.3222
- Pivot resistance is noted at 1.3411, 1.345, 1.3505
| Levels | Levels.1 |
|---|---|
| Previous Daily High | 1.3396 |
| Previous Daily Low | 1.3301 |
| Previous Weekly High | 1.3554 |
| Previous Weekly Low | 1.3301 |
| Previous Monthly High | 1.3862 |
| Previous Monthly Low | 1.3508 |
| Daily Fibonacci 38.2% | 1.3360 |
| Daily Fibonacci 61.8% | 1.3337 |
| Daily Pivot Point S1 | 1.3316 |
| Daily Pivot Point S2 | 1.3262 |
| Daily Pivot Point S3 | 1.3222 |
| Daily Pivot Point R1 | 1.3411 |
| Daily Pivot Point R2 | 1.3450 |
| Daily Pivot Point R3 | 1.3505 |
[/s2If]
Join Our Telegram Group
")


