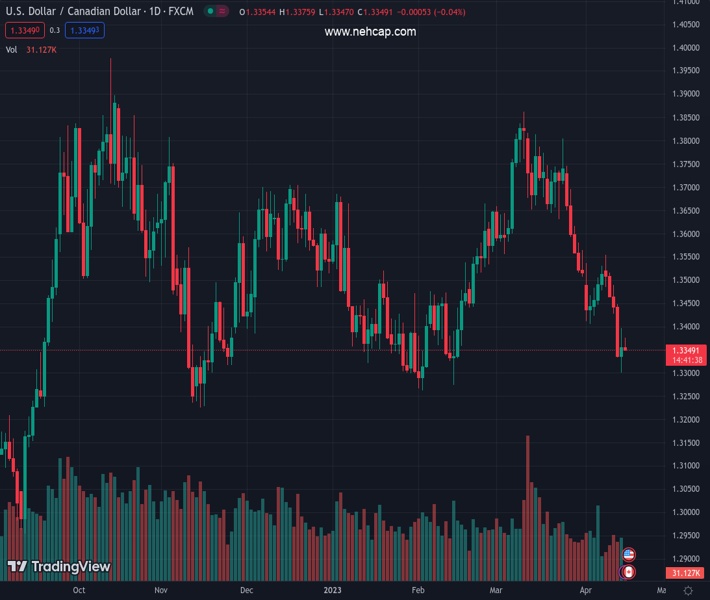
#USDCAD @ 1.33482 has dropped below 1.3350 amid exhaustion in the upside momentum of the USD Index. (Pivot Orderbook analysis)
…
This is a premium post.
[s2If !current_user_can(access_s2member_level4)]Please register for PREMIUM VERSION HERE to read full post below containing analysis. In case of any error or you think you are not able to read the full post below, please email us at support#nehcap.com [lwa][/s2If] [s2If current_user_can(access_s2member_level4)]
- USD/CAD has dropped below 1.3350 amid exhaustion in the upside momentum of the USD Index.
- Federal Reserve to hike rates despite softening of US Retail Sales as the core inflation is extremely stubborn.
- Bank of Canada might continue its neutral stance on interest rates if inflation continues to decline ahead.
- USD/CAD is declining towards potential supports placed at 1.3267 and 1.3226 respectively.
The pair currently trades last at 1.33482.
The previous day high was 1.3396 while the previous day low was 1.3301. The daily 38.2% Fib levels comes at 1.336, expected to provide resistance. Similarly, the daily 61.8% fib level is at 1.3337, expected to provide support.
The USD/CAD pair has slipped lower after displaying a back-and-forth action round 1.3360 in the early European session. The Loonie asset has sensed selling pressure as the US Dollar Index (DXY) has witnessed exhaustion in the bullish momentum after meeting the critical resistance of 101.80. Also, oil prices are rangebound, which has paused the Canadian Dollar. The USD Index has corrected to near 101.64 and is not showing any sign of recovery, at the time of writing.
It is worth noting that Canada is the leading exporter of oil to the United States and a change in oil price critically impacts the Canadian Dollar.
S&P500 futures generated some gains in early Asia and are managing to hold themselves, portraying a recovery in the risk appetite theme. US equities were mildly bearish on Friday as chances for consecutive 25 basis points (bps) rate hikes from the Federal Reserve (Fed) remained solid despite the release of the downside United States Retail Sales data. Also, American stocks are showing stock-specific action amid the quarterly result season.
The demand for US government bonds seems subdued as investors are divided on whether to turn bullish on the economy on expectations that the Federal Reserve will pause the rate-hiking spell sooner or to remain cautious about one more 25 bps rate hike from the Federal Reserve. Yields offered on 10-year US Treasury bonds are hovering around 3.52%.
There is no denying the fact that loosening the United States labor market conditions, softening Consumer Price Index (CPI) and Producer Price Index (PPI) reports, and easing retail demand are conveying that the Federal Reserve has to pause its policy-tightening spell sooner.
On Friday, monthly US Retail Sales (Mar) contracted dramatically by 1.0% while the street anticipated a contraction of 0.4%. Squeezing retail demand was the outcome of higher rates from the Federal Reserve and tight credit conditions from US commercial banks. The households have postponed demand for costly goods to avoid the higher cost of financing.
However, the core inflation is extremely stubborn, which indicates that the fight against stick inflation has a lot more to come.
Fed Governor Christopher Waller said on Friday that despite a year of aggressive rate increases, U.S. central bankers “haven’t made much progress” in returning inflation to their 2% target and need to move rates higher still. He further added “The job on inflation was still “not done,” as inflation remains “far too high.”
Investors are eyeing the release of Tuesday’s Canada’s inflation data (Mar), which will provide guidance on monetary policy action by the Bank of Canada (BoC). As per the expectations, the headline inflation will decelerate to 4.3% from the prior release of 5.2%. However, the monthly headline figure is seen expanding by 0.6% against an expansion of 0.4%, reported earlier.
Core CPI that excludes oil and food prices would soften to 4.2% vs. the former release of 4.7%. This may allow the Bank of Canada to continue its unchanged policy stance. Canada’s inflation is softening continuously, which has been supporting Bank of Canada Governor Tiff Macklem to remain neutral on interest rates.
USD/CAD resumed its downside journey after a pullback move to near 10-period Exponential Moving Average (EMA) around 1.3533 on a daily scale. Investors capitalized on the pullback move as a fresh selling opportunity. Potential supports are placed from February 01 and 15 November 2022 low at 1.3267 and 1.3226 respectively.
The Relative Strength Index (RSI) (14) has slipped again into the bearish range of 20.00-40.00 after a failed attempt for a range shift, which indicates that the upside is capped.
Technical Levels: Supports and Resistances
USDCAD currently trading at 1.3352 at the time of writing. Pair opened at 1.3371 and is trading with a change of -0.14 % .
| Overview | Overview.1 | |
|---|---|---|
| 0 | Today last price | 1.3352 |
| 1 | Today Daily Change | -0.0019 |
| 2 | Today Daily Change % | -0.1400 |
| 3 | Today daily open | 1.3371 |
The pair remains strongly bearish on the daily time frame. It trades below the 20 SMA @ 1.3545, 50 SMA 1.3563, 100 SMA @ 1.3531 and 200 SMA @ 1.3401.
| Trends | Trends.1 | |
|---|---|---|
| 0 | Daily SMA20 | 1.3545 |
| 1 | Daily SMA50 | 1.3563 |
| 2 | Daily SMA100 | 1.3531 |
| 3 | Daily SMA200 | 1.3401 |
The previous day high was 1.3396 while the previous day low was 1.3301. The daily 38.2% Fib levels comes at 1.336, expected to provide resistance. Similarly, the daily 61.8% fib level is at 1.3337, expected to provide support.
Note the levels of interest below:
- Pivot support is noted at 1.3316, 1.3262, 1.3222
- Pivot resistance is noted at 1.3411, 1.345, 1.3505
| Levels | Levels.1 |
|---|---|
| Previous Daily High | 1.3396 |
| Previous Daily Low | 1.3301 |
| Previous Weekly High | 1.3554 |
| Previous Weekly Low | 1.3301 |
| Previous Monthly High | 1.3862 |
| Previous Monthly Low | 1.3508 |
| Daily Fibonacci 38.2% | 1.3360 |
| Daily Fibonacci 61.8% | 1.3337 |
| Daily Pivot Point S1 | 1.3316 |
| Daily Pivot Point S2 | 1.3262 |
| Daily Pivot Point S3 | 1.3222 |
| Daily Pivot Point R1 | 1.3411 |
| Daily Pivot Point R2 | 1.3450 |
| Daily Pivot Point R3 | 1.3505 |
[/s2If]
Join Our Telegram Group
")


