#GBPJPY @ 166.354 prints mild gains within bearish chart formation., @nehcap view: Pullback expected (Pivot Orderbook analysis)
…
This is a premium post.
[s2If !current_user_can(access_s2member_level4)]Please register for PREMIUM VERSION HERE to read full post below containing analysis. In case of any error or you think you are not able to read the full post below, please email us at support#nehcap.com [lwa][/s2If] [s2If current_user_can(access_s2member_level4)]
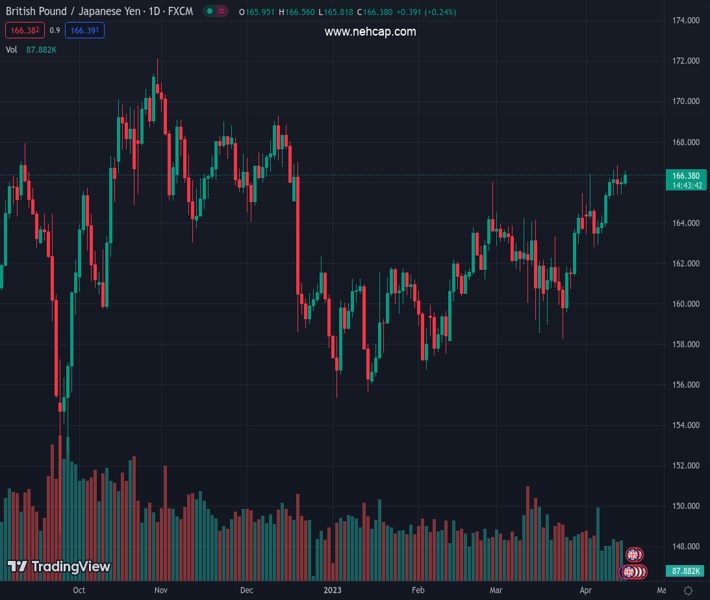
- GBP/JPY prints mild gains within bearish chart formation.
- Downbeat MACD signals, clear break of three-week-old previous support line keeps sellers hopeful.
- 100, 200 SMAs can prod bears before directing them to theoretical target of 162.30.
- Bulls need to cross the 167.00 hurdle to retake control.
The pair currently trades last at 166.354.
The previous day high was 166.23 while the previous day low was 165.42. The daily 38.2% Fib levels comes at 165.92, expected to provide support. Similarly, the daily 61.8% fib level is at 165.73, expected to provide support.
GBP/JPY remains mildly bid near 166.40 heading into Monday’s London open. In doing so, the cross-currency pair struggles to defend the four-day uptrend inside a short-term rising wedge bearish chart formation.
That said, the bearish MACD signals and the quote’s downside break of an upward-sloping support line from late March, now immediate resistance around 166.80, adds strength to the downside bias.
However, a clear break of the stated wedge’s lower line, close to 165.80 at the latest, becomes necessary for the GBP/JPY bear’s conviction.
Even so, the 100-SMA and the 200-SMA, respectively near 164.00 and 163.00, can challenge the cross-currency pair’s likely fall past 166.80 towards the theoretical target of around 162.30.
It’s worth noting that the monthly low of around 162.80 also acts as an extra filter towards the south.
Meanwhile, GBP/JPY recovery needs to cross the previous support line, close to 166.80, to convince intraday buyers.
Following that, the stated wedge’s top line and the recent high, close to 167.00, may test the upside before defying the bearish chart formation.
In that case, a run-up towards the late 2022 peak of around 169.30 and then towards the 170.00 round figure can’t be ruled out.
Overall, GBP/JPY buyers appear to run out of steam ahead of the key data week for the UK.
Trend: Pullback expected
Technical Levels: Supports and Resistances
GBPJPY currently trading at 166.32 at the time of writing. Pair opened at 166.07 and is trading with a change of 0.15% % .
| Overview | Overview.1 | |
|---|---|---|
| 0 | Today last price | 166.32 |
| 1 | Today Daily Change | 0.25 |
| 2 | Today Daily Change % | 0.15% |
| 3 | Today daily open | 166.07 |
The pair remains strongly bullish on the daily timeframe. It trades above its 20 SMA @ 163.53, 50 SMA 162.46, 100 SMA @ 162.17 and 200 SMA @ 163.21.
| Trends | Trends.1 | |
|---|---|---|
| 0 | Daily SMA20 | 163.53 |
| 1 | Daily SMA50 | 162.46 |
| 2 | Daily SMA100 | 162.17 |
| 3 | Daily SMA200 | 163.21 |
The previous day high was 166.23 while the previous day low was 165.42. The daily 38.2% Fib levels comes at 165.92, expected to provide support. Similarly, the daily 61.8% fib level is at 165.73, expected to provide support.
Note the levels of interest below:
- Pivot support is noted at 165.58, 165.09, 164.77
- Pivot resistance is noted at 166.4, 166.72, 167.21
| Levels | Levels.1 |
|---|---|
| Previous Daily High | 166.23 |
| Previous Daily Low | 165.42 |
| Previous Weekly High | 166.85 |
| Previous Weekly Low | 163.81 |
| Previous Monthly High | 165.47 |
| Previous Monthly Low | 158.27 |
| Daily Fibonacci 38.2% | 165.92 |
| Daily Fibonacci 61.8% | 165.73 |
| Daily Pivot Point S1 | 165.58 |
| Daily Pivot Point S2 | 165.09 |
| Daily Pivot Point S3 | 164.77 |
| Daily Pivot Point R1 | 166.40 |
| Daily Pivot Point R2 | 166.72 |
| Daily Pivot Point R3 | 167.21 |
[/s2If]
Join Our Telegram Group
")


