#USDMXN @ 17.9763 holds lower grounds after breaking five-week-old key support line., @nehcap view: Further downside expected (Pivot Orderbook analysis)
…
This is a premium post.
[s2If !current_user_can(access_s2member_level4)]Please register for PREMIUM VERSION HERE to read full post below containing analysis. In case of any error or you think you are not able to read the full post below, please email us at support#nehcap.com [lwa][/s2If] [s2If current_user_can(access_s2member_level4)]
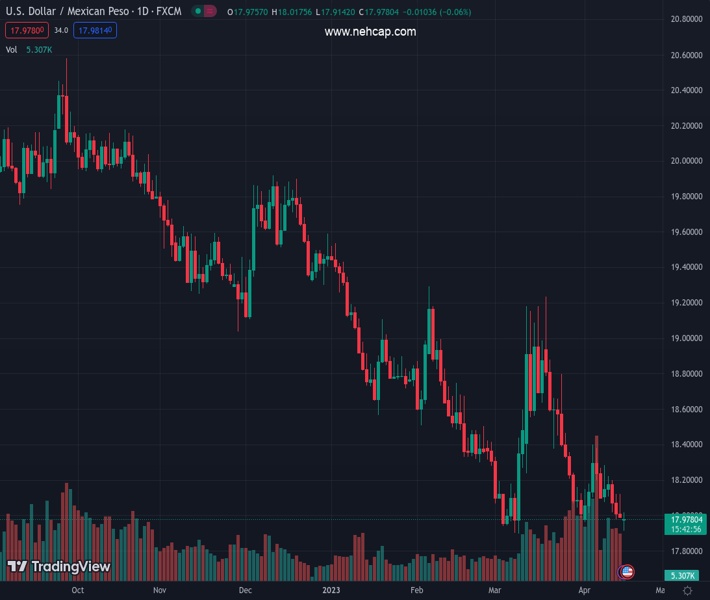
- USD/MXN holds lower grounds after breaking five-week-old key support line.
- Bearish MACD signals, absence of oversold RSI conditions keep Mexican Peso buyers hopeful of targeting 17.80.
- July 2017 low becomes crucial support for USD/MXN bears to watch.
- Buyers remain off the table below 200-SMA hurdle, support-turned-resistance line from March guards immediate upside.
The pair currently trades last at 17.9763.
The previous day high was 18.1216 while the previous day low was 18.0027. The daily 38.2% Fib levels comes at 18.0762, expected to provide resistance. Similarly, the daily 61.8% fib level is at 18.0481, expected to provide resistance.
USD/MXN bears attack 18.00 threshold after breaking a short-term key support line early Monday. That said, the Mexican Peso pair remains pressured towards the yearly low marked in early March, around 17.98 by the press time.
Given the absence of an oversold RSI (14), the USD/MXN price is likely to decline further and hence a fresh 2023 bottom, currently around 17.89 can’t be ruled out.
In that case, multiple lows marked in June 2017 around 17.80 gain the market’s attention. However, the year 2017 bottom surrounding 17.44 could challenge the USD/MXN bears afterward.
If not, then the quote’s south run towards the 17.00 round figure can’t be ruled out.
On the flip side, recovery moves need to stay beyond the immediate support-turned-resistance line, around the 18.00 threshold.
Following that, a three-week-old resistance line near 18.05 could challenge the USD/MXN rebound.
However, the Mexican Peso buyers keep the reins unless the quote stays comfortably beyond the 200-SMA hurdle surrounding 18.32.
Overall, USD/MXN is well set for fresh 2023 bottom but the downside room appears limited.
Trend: Further downside expected
Technical Levels: Supports and Resistances
USDMXN currently trading at 17.9777 at the time of writing. Pair opened at 18.0172 and is trading with a change of -0.22% % .
| Overview | Overview.1 | |
|---|---|---|
| 0 | Today last price | 17.9777 |
| 1 | Today Daily Change | -0.0395 |
| 2 | Today Daily Change % | -0.22% |
| 3 | Today daily open | 18.0172 |
The pair remains strongly bearish on the daily time frame. It trades below the 20 SMA @ 18.2591, 50 SMA 18.4014, 100 SMA @ 18.8247 and 200 SMA @ 19.4236.
| Trends | Trends.1 | |
|---|---|---|
| 0 | Daily SMA20 | 18.2591 |
| 1 | Daily SMA50 | 18.4014 |
| 2 | Daily SMA100 | 18.8247 |
| 3 | Daily SMA200 | 19.4236 |
The previous day high was 18.1216 while the previous day low was 18.0027. The daily 38.2% Fib levels comes at 18.0762, expected to provide resistance. Similarly, the daily 61.8% fib level is at 18.0481, expected to provide resistance.
Note the levels of interest below:
- Pivot support is noted at 17.9727, 17.9282, 17.8537
- Pivot resistance is noted at 18.0916, 18.1661, 18.2106
| Levels | Levels.1 |
|---|---|
| Previous Daily High | 18.1216 |
| Previous Daily Low | 18.0027 |
| Previous Weekly High | 18.2844 |
| Previous Weekly Low | 17.9753 |
| Previous Monthly High | 19.2324 |
| Previous Monthly Low | 17.8977 |
| Daily Fibonacci 38.2% | 18.0762 |
| Daily Fibonacci 61.8% | 18.0481 |
| Daily Pivot Point S1 | 17.9727 |
| Daily Pivot Point S2 | 17.9282 |
| Daily Pivot Point S3 | 17.8537 |
| Daily Pivot Point R1 | 18.0916 |
| Daily Pivot Point R2 | 18.1661 |
| Daily Pivot Point R3 | 18.2106 |
[/s2If]
Join Our Telegram Group
")


