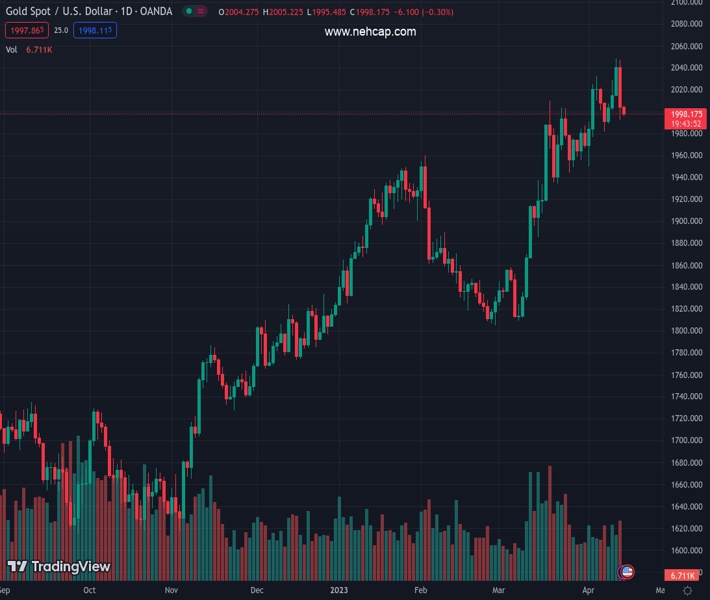
#XAUUSD @ 1,997.34 Gold price looks vulnerable above $2,000.00 as Fed to raise rates further. (Pivot Orderbook analysis)
…
This is a premium post.
[s2If !current_user_can(access_s2member_level4)]Please register for PREMIUM VERSION HERE to read full post below containing analysis. In case of any error or you think you are not able to read the full post below, please email us at support#nehcap.com [lwa][/s2If] [s2If current_user_can(access_s2member_level4)]
- Gold price looks vulnerable above $2,000.00 as Fed to raise rates further.
- US equities are expected to remain stock-specific amid quarterly results season.
- Gold price is expected to decline further towards the upward-sloping trendline plotted from $1,934.34.
The pair currently trades last at 1997.34.
The previous day high was 2047.49 while the previous day low was 1992.45. The daily 38.2% Fib levels comes at 2013.48, expected to provide resistance. Similarly, the daily 61.8% fib level is at 2026.46, expected to provide resistance.
Gold price (XAU/USD) is looking vulnerable above the psychological resistance of $2,000.00 in the Asian session. The precious metal has shown a recovery move after printing a four-day low of $1,992.50. However, the recovery move looks fragile as the upside is capped due to bullish bets for the US Dollar Index (DXY).
The USD Index is looking to extend its recovery above the immediate resistance of 101.75 as the likelihood of a consecutive 25 basis point (bp) rate hike from the Federal Reserve (Fed) is extremely solid. The result from the CME Fedwatch tool conveys that the chances of a rate hike are almost 80%.
Meanwhile, S&P500 futures have added significant gains on early Monday after a mild sell-off on Friday. US equities are expected to remain stock-specific amid quarterly results season. Manufacturing and oil dependent companies could show some decent recovery in earnings as gasoline prices were extremely lower in March.
The demand for US government bonds has dropped significantly amid soaring bets for further policy restrictions by the Fed. Atlanta Fed President Raphael Bostic, said one more quarter-percentage-point interest rate hike can allow the Fed to end its tightening cycle with some confidence that inflation will steadily return to its 2% target.
Gold price witnessed a steep fall after failing to test the critical resistance of $2,050.00 on Thursday. The yellow metal corrected sharply and dropped below the upward-sloping trendline plotted from April 03 low at $1,950.52. The Gold price is expected to decline further towards the advancing trendline placed from March 22 low at $1,934.34.
The precious metal has dropped below the 50-period Exponential Moving Average (EMA) at $2,016.83, which indicates that the short-term trend has turned bearish.
Meanwhile, the Relative Strength Index (RSI) (14) has slipped into the bearish range of 20.00-40.00, indicating more weakness ahead.
Technical Levels: Supports and Resistances
XAUUSD currently trading at 2002.24 at the time of writing. Pair opened at 2004.2 and is trading with a change of -0.1 % .
| Overview | Overview.1 | |
|---|---|---|
| 0 | Today last price | 2002.24 |
| 1 | Today Daily Change | -1.96 |
| 2 | Today Daily Change % | -0.10 |
| 3 | Today daily open | 2004.20 |
The pair remains strongly bullish on the daily timeframe. It trades above its 20 SMA @ 1989.11, 50 SMA 1907.04, 100 SMA @ 1875.45 and 200 SMA @ 1793.7.
| Trends | Trends.1 | |
|---|---|---|
| 0 | Daily SMA20 | 1989.11 |
| 1 | Daily SMA50 | 1907.04 |
| 2 | Daily SMA100 | 1875.45 |
| 3 | Daily SMA200 | 1793.70 |
The previous day high was 2047.49 while the previous day low was 1992.45. The daily 38.2% Fib levels comes at 2013.48, expected to provide resistance. Similarly, the daily 61.8% fib level is at 2026.46, expected to provide resistance.
Note the levels of interest below:
- Pivot support is noted at 1981.94, 1959.67, 1926.9
- Pivot resistance is noted at 2036.98, 2069.75, 2092.02
| Levels | Levels.1 |
|---|---|
| Previous Daily High | 2047.49 |
| Previous Daily Low | 1992.45 |
| Previous Weekly High | 2048.75 |
| Previous Weekly Low | 1986.28 |
| Previous Monthly High | 2009.88 |
| Previous Monthly Low | 1809.46 |
| Daily Fibonacci 38.2% | 2013.48 |
| Daily Fibonacci 61.8% | 2026.46 |
| Daily Pivot Point S1 | 1981.94 |
| Daily Pivot Point S2 | 1959.67 |
| Daily Pivot Point S3 | 1926.90 |
| Daily Pivot Point R1 | 2036.98 |
| Daily Pivot Point R2 | 2069.75 |
| Daily Pivot Point R3 | 2092.02 |
[/s2If]
Join Our Telegram Group
")


