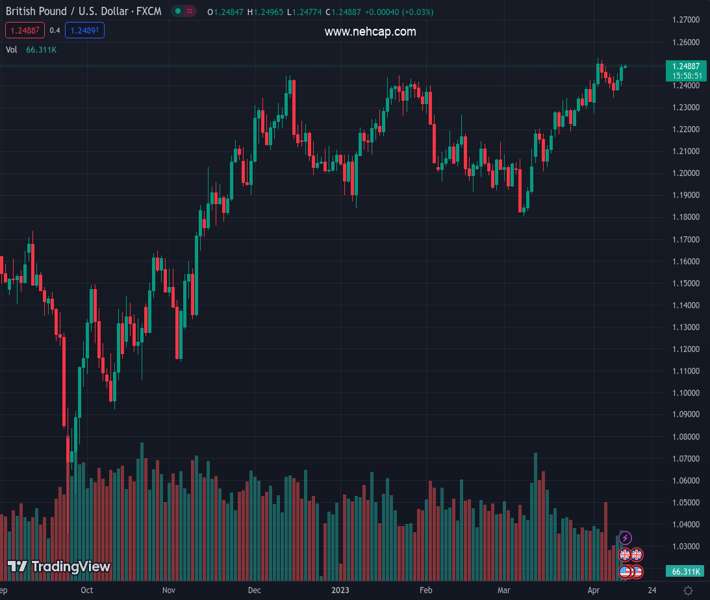
#GBPUSD @ 1.24161 has shifted its auction confidently above 1.2400 amid a cheerful market mood. (Pivot Orderbook analysis)
…
This is a premium post.
[s2If !current_user_can(access_s2member_level4)]Please register for PREMIUM VERSION HERE to read full post below containing analysis. In case of any error or you think you are not able to read the full post below, please email us at support#nehcap.com [lwa][/s2If] [s2If current_user_can(access_s2member_level4)]
- GBP/USD has shifted its auction confidently above 1.2400 amid a cheerful market mood.
- Investors have digested hawkish Federal Reserve bets despite expectations of a rebound in US core inflation.
- Bank of England might continue hiking rates further amid an absence of signs of UK inflation softening.
- GBP/USD is gathering strength for a breakout of the Falling Channel chart formation.
The pair currently trades last at 1.24161.
The previous day high was 1.2443 while the previous day low was 1.2344. The daily 38.2% Fib levels comes at 1.2382, expected to provide support. Similarly, the daily 61.8% fib level is at 1.2405, expected to provide support.
GBP/USD has managed to shift its auction above the round-level resistance of 1.2400 in the early European session. The Cable has attracted bids as investors are showing maturity to the accelerating chances of more rate hikes from the Federal Reserve (Fed). The US Dollar has remained in a negative trajectory in the Asian session as anxiety among the market participants ahead of the release of the United States Consumer Price Index (CPI) has receded.
The US Dollar Index (DXY) looks vulnerable above the immediate cushion of 102.30 as the market mood is extremely upbeat. S&P500 futures are holding nominal gains in the Asian session. US equities showed resilience on Monday after a gap-down opening, which indicates that the downside is capped.
Despite weaker consensus for profits to be delivered S&P500, investors are supporting the US equity domain. As per Refinitiv estimates, S&P500 is expected to report shrinkage in profits by 5.2% vs. a growth forecast of 1.4% anticipated at the start of the year. The downgraded forecast for S&P500 is backed by higher rates from the Federal Reserve and tight credit conditions from US commercial banks, which have squeezed advances to firms.
Positive market sentiment has also barricaded US yields from further upside. The 10-year US Treasury yields look sluggish below 3.41%.
The market participants have ignored rising bets for a consecutive 25 basis points (bps) rate hike from the Federal Reserve and have started pouring funds into the risk-sensitive assets. Investors seem assured about the continuation of rate hikes from the Federal Reserve as the US labor market has not shown meaningful signs of slowdown despite higher rates and tight credit conditions.
The US Dollar remained in a negative trajectory in the Asian session after less-hawkish commentary from New York Fed Bank president John C. Williams. Federal Reserve Williams stated that inflation will be around 3.75% this year, the growth rate will be less than 1% and the Unemployment Rate will gradually rise to 4-4.5%. This indicates that inflation will soften ahead and hopes for rate cuts will be alive. On banking turmoil, Fed Williams believes that higher rates by the Federal Reserve were not the cause of recent banking stress. This has reduced fears of further banking turmoil if the hawkish monetary policy from the Federal Reserve is not responsible for banking collapse.
Investors are very much curious about the release of the US CPI data as it will be the last inflation figures before the interest rate decision from the Federal Reserve, which will be announced in the first week of May. Therefore, Wednesday’s US Inflation data carries a higher value. Analysts at TD Securities expect the headline inflation to rise by 0.1% in March, and the core CPI by 0.4%. They see the CPI slowing to 3.6% by the fourth quarter.
March’s US headline inflation is expected to be softened by consistently lower oil prices, which had eventually provided gas to end consumers at more affordable prices. While core inflation could be spurted due to the higher labor cost index, which has filled households with ample funds for disposal.
The United Kingdom is one of the nations that are critically struggling to bring down galloping inflation. Interest rates by the Bank of England (BoE) have reached decade highs, and the UK administration has offered monetary incentives for postponement of early retirement, however, the price index has not shown any sign of softening yet.
The release of the Like-for Like Retail Sales by the British Retail Consortium remained steady at 4.9%. A continuation of robust retail demand is expected to keep inflationary pressures at elevated rates.
GBP/USD is gathering strength to deliver a breakout of the Falling Channel formed on an hourly scale. The Cable showed a reversal on Monday after observing the presence of responsive buyers around 1.2350. The Pound Sterling has pushed the asset above the 20-period Exponential Moving Average (EMA) at around 1.2400, which indicates that the short-term trend has turned bullish.
Meanwhile, the Relative Strength Index (RSI) (14) is still in the 40.00-60.00 range. A break above 60.00 will trigger the bullish momentum.
Technical Levels: Supports and Resistances
GBPUSD currently trading at 1.2407 at the time of writing. Pair opened at 1.2382 and is trading with a change of 0.2 % .
| Overview | Overview.1 | |
|---|---|---|
| 0 | Today last price | 1.2407 |
| 1 | Today Daily Change | 0.0025 |
| 2 | Today Daily Change % | 0.2000 |
| 3 | Today daily open | 1.2382 |
The pair remains strongly bullish on the daily timeframe. It trades above its 20 SMA @ 1.2303, 50 SMA 1.2156, 100 SMA @ 1.2165 and 200 SMA @ 1.1903.
| Trends | Trends.1 | |
|---|---|---|
| 0 | Daily SMA20 | 1.2303 |
| 1 | Daily SMA50 | 1.2156 |
| 2 | Daily SMA100 | 1.2165 |
| 3 | Daily SMA200 | 1.1903 |
The previous day high was 1.2443 while the previous day low was 1.2344. The daily 38.2% Fib levels comes at 1.2382, expected to provide support. Similarly, the daily 61.8% fib level is at 1.2405, expected to provide support.
Note the levels of interest below:
- Pivot support is noted at 1.2337, 1.2291, 1.2238
- Pivot resistance is noted at 1.2435, 1.2488, 1.2533
| Levels | Levels.1 |
|---|---|
| Previous Daily High | 1.2443 |
| Previous Daily Low | 1.2344 |
| Previous Weekly High | 1.2525 |
| Previous Weekly Low | 1.2275 |
| Previous Monthly High | 1.2424 |
| Previous Monthly Low | 1.1803 |
| Daily Fibonacci 38.2% | 1.2382 |
| Daily Fibonacci 61.8% | 1.2405 |
| Daily Pivot Point S1 | 1.2337 |
| Daily Pivot Point S2 | 1.2291 |
| Daily Pivot Point S3 | 1.2238 |
| Daily Pivot Point R1 | 1.2435 |
| Daily Pivot Point R2 | 1.2488 |
| Daily Pivot Point R3 | 1.2533 |
[/s2If]
Join Our Telegram Group


