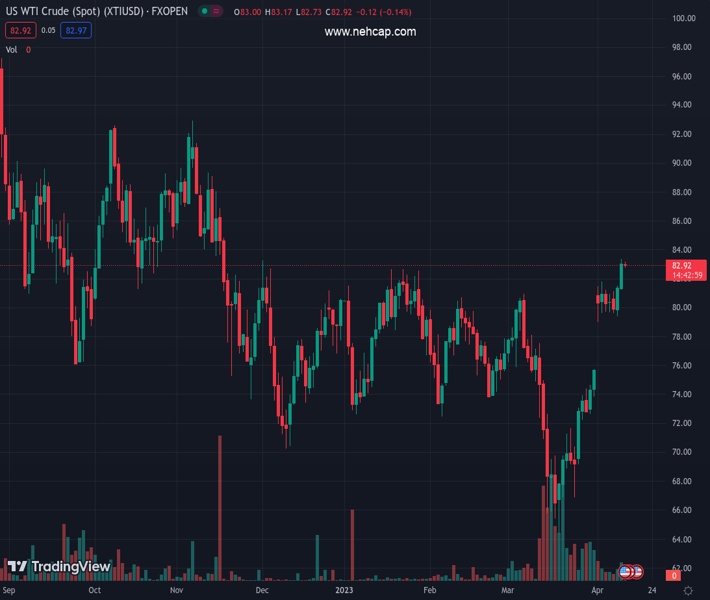
WTI crude oil renews intraday high while staying inside one-week-old trading range near multi-day high. (Pivot Orderbook analysis)
…
This is a premium post.
[s2If !current_user_can(access_s2member_level4)]Please register for PREMIUM VERSION HERE to read full post below containing analysis. In case of any error or you think you are not able to read the full post below, please email us at support#nehcap.com [lwa][/s2If] [s2If current_user_can(access_s2member_level4)]
- WTI crude oil renews intraday high while staying inside one-week-old trading range near multi-day high.
- Cautious optimism joins softer US Dollar to underpin Oil price recovery.
- China inflation eases in March but end of military drills near Taiwan, optimism surrounding India, Beijing favors WTI bulls.
- Return of full markets, API weekly stockpiles eyed for fresh impulse.
The pair currently trades last at 80.41.
The previous day high was 81.19 while the previous day low was 79.64. The daily 38.2% Fib levels comes at 80.23, expected to provide support. Similarly, the daily 61.8% fib level is at 80.6, expected to provide resistance.
WTI crude oil refreshes intraday high near $80.40 as it cheers mildly positive market sentiment, as well as a softer US Dollar, heading into Tuesday’s European session. Even so, the black gold remains within a one-week-old trading range of about $2.0 as full markets return after an extended weekend.
That said, the US Dollar Index (DXY) snaps a four-day uptrend while declining to 102.35 by the press time, down 0.20% intraday. In doing so, the greenback bears the burden of comments from the Federal Reserve (Fed) Bank of New York President, as well as the Fed’s Vice Chairman of the rate-setting committee, John Williams, as he cites increasing odds of easy inflation. On the same line were statements from Rick Rieder, Chief Investment Officer of global fixed income at BlackRock, the world’s largest asset manager, who said late Monday, “The Federal Reserve may not need to raise interest rates further to fight inflation, as the fallout from last month’s turmoil in the banking sector and a series of recent labor data point to a slowing US economy,” per Reuters.
On a different page, the end of China’s military drills near Taiwan joins the Aussie-China trade deal and hopes for more investment in Japan to portray the cautious optimism in the markets. Additionally favoring the optimists were upbeat headlines from the International Monetary Fund’s (IMF) Managing Director Kristalina Georgieva who said on Monday that the global economy is estimated to grow less than 3% in 2023, with India and China expected to account for half of the global growth this year.
Even so, CME’s FedWatch Tool prints nearly 71% odds of the US Central Bank’s 0.25% rate hike in May and challenges the market sentiment, as well as the WTI crude oil buyers. Also weighing on the risk appetite and the energy benchmark’s prices could be the downbeat China inflation data and cautious mood ahead of top-tier US data/events.
Above all, the OPEC+ supply cuts join improving hopes of more energy demand from the world’s largest energy consumer, namely China, to underpin WTI crude oil’s upside momentum.
Moving on, the weekly print of the Oil inventories from the American Petroleum Institute (API), previous -4.346M, could direct WTI prices. However, major attention will be given to IMF’s spring summit and US inflation, as well as the Fed Minutes, for clear directions.
WTI crude oil buyers seem running out of fuel after printing multiple defeats from a four-month-old resistance line, around $81.65 by the press time.
Technical Levels: Supports and Resistances
XTIUSD currently trading at 80.41 at the time of writing. Pair opened at 79.93 and is trading with a change of 0.60% % .
| Overview | Overview.1 | |
|---|---|---|
| 0 | Today last price | 80.41 |
| 1 | Today Daily Change | 0.48 |
| 2 | Today Daily Change % | 0.60% |
| 3 | Today daily open | 79.93 |
The pair is trading above its 20 Daily moving average @ 73.38, above its 50 Daily moving average @ 75.75 , above its 100 Daily moving average @ 76.79 and below its 200 Daily moving average @ 82.96
| Trends | Trends.1 | |
|---|---|---|
| 0 | Daily SMA20 | 73.38 |
| 1 | Daily SMA50 | 75.75 |
| 2 | Daily SMA100 | 76.79 |
| 3 | Daily SMA200 | 82.96 |
The previous day high was 81.19 while the previous day low was 79.64. The daily 38.2% Fib levels comes at 80.23, expected to provide support. Similarly, the daily 61.8% fib level is at 80.6, expected to provide resistance.
Note the levels of interest below:
- Pivot support is noted at 79.32, 78.71, 77.77
- Pivot resistance is noted at 80.86, 81.8, 82.41
| Levels | Levels.1 |
|---|---|
| Previous Daily High | 81.19 |
| Previous Daily Low | 79.64 |
| Previous Weekly High | 81.81 |
| Previous Weekly Low | 75.76 |
| Previous Monthly High | 80.99 |
| Previous Monthly Low | 64.39 |
| Daily Fibonacci 38.2% | 80.23 |
| Daily Fibonacci 61.8% | 80.60 |
| Daily Pivot Point S1 | 79.32 |
| Daily Pivot Point S2 | 78.71 |
| Daily Pivot Point S3 | 77.77 |
| Daily Pivot Point R1 | 80.86 |
| Daily Pivot Point R2 | 81.80 |
| Daily Pivot Point R3 | 82.41 |
[/s2If]
Join Our Telegram Group


