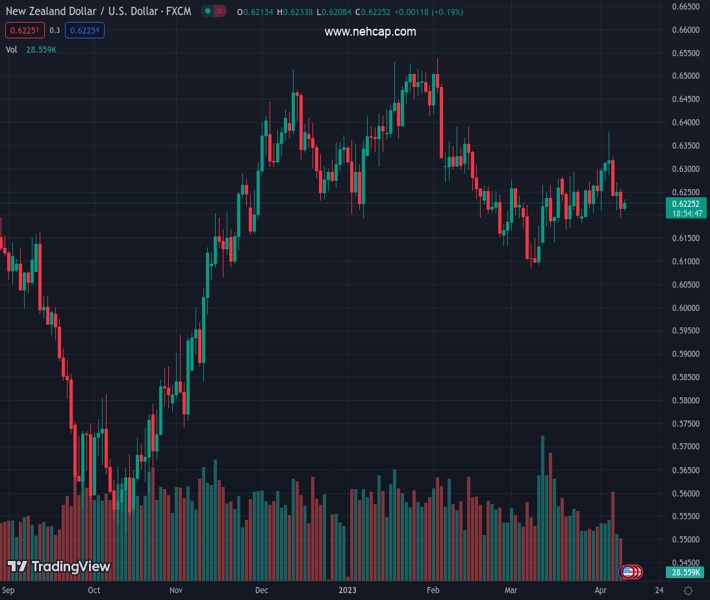
#NZDUSD @ 0.62211 extends pullback from intraday high on softer China inflation figures for March. (Pivot Orderbook analysis)
…
This is a premium post.
[s2If !current_user_can(access_s2member_level4)]Please register for PREMIUM VERSION HERE to read full post below containing analysis. In case of any error or you think you are not able to read the full post below, please email us at support#nehcap.com [lwa][/s2If] [s2If current_user_can(access_s2member_level4)]
- NZD/USD extends pullback from intraday high on softer China inflation figures for March.
- China CPI drops to 0.7% YoY, PPI also eases to -2.5% YoY.
- Markets remain cautiously optimistic as yields retreat, China ends military drills near Taiwan.
- Hawkish Fed bets, recession woes keep Kiwi bears hopeful ahead of key US data, Fed Minutes.
The pair currently trades last at 0.62211.
The previous day high was 0.6265 while the previous day low was 0.6193. The daily 38.2% Fib levels comes at 0.622, expected to provide support. Similarly, the daily 61.8% fib level is at 0.6237, expected to provide resistance.
NZD/USD takes offers to refresh intraday low near 0.6210 on downbeat China inflation data, published early Tuesday. Adding strength to the Kiwi pair’s pullback moves could be the hawkish Fed bets and the return of full markets.
That said, China’s headline inflation numbers for March, namely the Consumer Price Index (CPI) and Producer Price Index (PPI), came in 0.7% YoY and -2.5% YoY versus 1.0% and -1.4% respective priors.
Also read: China’s CPI softens to 0.7% YoY in March vs. 1.0% expected
On the other hand, Friday’s upbeat US employment data joins the market’s rejection of recession woes to underpin the hawkish Fed bets. While portraying the same, CME’s FedWatch Tool suggests a 72% chance of the Fed’s 0.25% rate hike in May, versus 57% odds favoring the same in the last week.
It should be noted that the Kiwi pair portrayed a corrective bounce earlier in Asia as mixed concerns surrounding the US Federal Reserve’s (Fed) next move join headlines suggesting China’s end to the military strikes near Taiwan.
That said, Federal Reserve (Fed) Bank of New York President, as well as the Fed’s Vice Chairman of the rate-setting committee, John Williams anticipated slower inflation while ruling out the interest rates as culprits for the previous month’s bank fallouts. On the same line, Rick Rieder, Chief Investment Officer of global fixed income at BlackRock, the world’s largest asset manager, said late Monday, “The Federal Reserve may not need to raise interest rates further to fight inflation, as the fallout from last month’s turmoil in the banking sector and a series of recent labor data point to a slowing US economy,” per Reuters.
On the other hand, Reuters said that China ended three days of military drills around Taiwan on Monday saying they had tested integrated military capabilities under actual combat conditions, having practiced precision strikes and blockading the island that Beijing views as its own.
Amid these plays, the S&P 500 Futures print mild gains while the US 10-year and two-year Treasury bond yields retreat to 3.40% and 3.99% at the latest.
Having witnessed the initial market reaction to China’s headline inflation data, NZD/USD pair traders should pay attention to the risk catalysts and the trading moves amid full markets. However, major attention should be given to Wednesday’s US CPI and Fed Minutes amid hawkish concerns about the US central bank’s next moves.
Unless rising back beyond a one-month-old previous support line, now immediate resistance near 0.6265, the NZD/USD bears remain on their way to refreshing the year 2023 bottom of 0.6084.
Technical Levels: Supports and Resistances
NZDUSD currently trading at 0.6215 at the time of writing. Pair opened at 0.6217 and is trading with a change of -0.03% % .
| Overview | Overview.1 | |
|---|---|---|
| 0 | Today last price | 0.6215 |
| 1 | Today Daily Change | -0.0002 |
| 2 | Today Daily Change % | -0.03% |
| 3 | Today daily open | 0.6217 |
The pair is trading below its 20 Daily moving average @ 0.6243, below its 50 Daily moving average @ 0.6254 , below its 100 Daily moving average @ 0.6303 and above its 200 Daily moving average @ 0.616
| Trends | Trends.1 | |
|---|---|---|
| 0 | Daily SMA20 | 0.6243 |
| 1 | Daily SMA50 | 0.6254 |
| 2 | Daily SMA100 | 0.6303 |
| 3 | Daily SMA200 | 0.6160 |
The previous day high was 0.6265 while the previous day low was 0.6193. The daily 38.2% Fib levels comes at 0.622, expected to provide support. Similarly, the daily 61.8% fib level is at 0.6237, expected to provide resistance.
Note the levels of interest below:
- Pivot support is noted at 0.6185, 0.6153, 0.6114
- Pivot resistance is noted at 0.6257, 0.6297, 0.6329
| Levels | Levels.1 |
|---|---|
| Previous Daily High | 0.6265 |
| Previous Daily Low | 0.6193 |
| Previous Weekly High | 0.6389 |
| Previous Weekly Low | 0.6207 |
| Previous Monthly High | 0.6298 |
| Previous Monthly Low | 0.6084 |
| Daily Fibonacci 38.2% | 0.6220 |
| Daily Fibonacci 61.8% | 0.6237 |
| Daily Pivot Point S1 | 0.6185 |
| Daily Pivot Point S2 | 0.6153 |
| Daily Pivot Point S3 | 0.6114 |
| Daily Pivot Point R1 | 0.6257 |
| Daily Pivot Point R2 | 0.6297 |
| Daily Pivot Point R3 | 0.6329 |
[/s2If]
Join Our Telegram Group


