#GBPUSD @ 1.23897 picks up bids to snap four-day downtrend, bounces off one-week low., @nehcap view: Further downside expected (Pivot Orderbook analysis)
…
This is a premium post.
[s2If !current_user_can(access_s2member_level4)]Please register for PREMIUM VERSION HERE to read full post below containing analysis. In case of any error or you think you are not able to read the full post below, please email us at support#nehcap.com [lwa][/s2If] [s2If current_user_can(access_s2member_level4)]
- GBP/USD picks up bids to snap four-day downtrend, bounces off one-week low.
- 10-DMA, looming bear cross on MACD challenges Cable pair buyers.
- 12-day-old ascending support line holds the key to further downside.
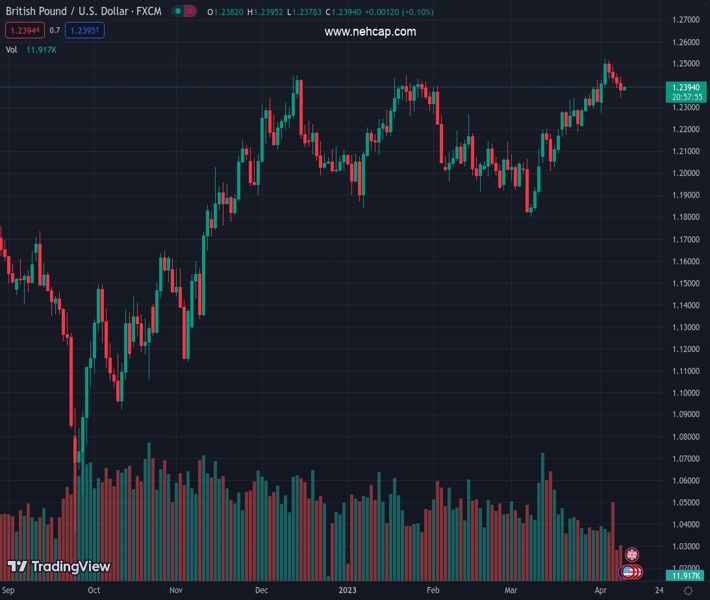
The pair currently trades last at 1.23897.
The previous day high was 1.2456 while the previous day low was 1.2389. The daily 38.2% Fib levels comes at 1.2415, expected to provide resistance. Similarly, the daily 61.8% fib level is at 1.243, expected to provide resistance.
GBP/USD prints the first daily gains in five around 1.2390 as full markets return on Tuesday. In doing so, the Cable pair bounces off the lowest levels in a week.
That said, a two-week-old ascending trend line, around 1.2355 by the press time, triggered the GBP/USD pair’s rebound the previous day.
However, the quote’s sustained trading below the 10-DMA hurdle and an impending bear cross on the MACD keeps GBP/USD sellers hopeful. Adding strength to the downside bias is the RSI (14) line’s retreat from the overbought territory.
Hence, the quote’s latest rebound remains elusive unless it stays below the 10-DMA hurdle of 1.2405.
Even if the GBP/USD buyers manage to cross the 1.2405 resistance, a four-month-old horizontal line and previous support trend line stretched from mid-March, respectively near 1.2445 and 1.2510, could challenge the pair’s further upside.
It’s worth noting that the latest multi-month high of 1.2525, marked the last week, also acts as an extra upside filter to watch for Cable buyers.
On the flip side, the aforementioned support line stretched from March 24, close to 1.2355, restricts the immediate downside of the GBP/USD pair, a break of which could quickly drag the quote towards 1.2300 and then to February’s high of near 1.2270.
Trend: Further downside expected
Technical Levels: Supports and Resistances
GBPUSD currently trading at 1.239 at the time of writing. Pair opened at 1.2418 and is trading with a change of -0.23% % .
| Overview | Overview.1 | |
|---|---|---|
| 0 | Today last price | 1.239 |
| 1 | Today Daily Change | -0.0028 |
| 2 | Today Daily Change % | -0.23% |
| 3 | Today daily open | 1.2418 |
The pair remains strongly bullish on the daily timeframe. It trades above its 20 SMA @ 1.2293, 50 SMA 1.2156, 100 SMA @ 1.2159 and 200 SMA @ 1.1902.
| Trends | Trends.1 | |
|---|---|---|
| 0 | Daily SMA20 | 1.2293 |
| 1 | Daily SMA50 | 1.2156 |
| 2 | Daily SMA100 | 1.2159 |
| 3 | Daily SMA200 | 1.1902 |
The previous day high was 1.2456 while the previous day low was 1.2389. The daily 38.2% Fib levels comes at 1.2415, expected to provide resistance. Similarly, the daily 61.8% fib level is at 1.243, expected to provide resistance.
Note the levels of interest below:
- Pivot support is noted at 1.2386, 1.2354, 1.2319
- Pivot resistance is noted at 1.2453, 1.2488, 1.252
| Levels | Levels.1 |
|---|---|
| Previous Daily High | 1.2456 |
| Previous Daily Low | 1.2389 |
| Previous Weekly High | 1.2525 |
| Previous Weekly Low | 1.2275 |
| Previous Monthly High | 1.2424 |
| Previous Monthly Low | 1.1803 |
| Daily Fibonacci 38.2% | 1.2415 |
| Daily Fibonacci 61.8% | 1.2430 |
| Daily Pivot Point S1 | 1.2386 |
| Daily Pivot Point S2 | 1.2354 |
| Daily Pivot Point S3 | 1.2319 |
| Daily Pivot Point R1 | 1.2453 |
| Daily Pivot Point R2 | 1.2488 |
| Daily Pivot Point R3 | 1.2520 |
[/s2If]
Join Our Telegram Group


