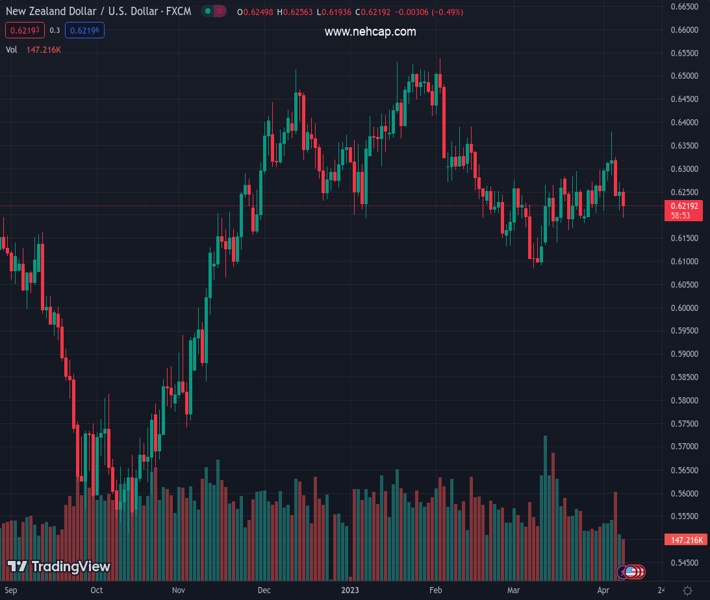
#NZDUSD @ 0.62193 New Bank of Japan Governor Kazuo Ueda spurred US Dollar buying. (Pivot Orderbook analysis)
…
This is a premium post.
[s2If !current_user_can(access_s2member_level4)]Please register for PREMIUM VERSION HERE to read full post below containing analysis. In case of any error or you think you are not able to read the full post below, please email us at support#nehcap.com [lwa][/s2If] [s2If current_user_can(access_s2member_level4)]
- New Bank of Japan Governor Kazuo Ueda spurred US Dollar buying.
- Speculation that the tightening cycle is over weighed on investors’ mood.
- NZD/USD is neutral-to-bearish around 0.6220, could extend its slump.
The pair currently trades last at 0.62193.
The previous day high was 0.6389 while the previous day low was 0.6209. The daily 38.2% Fib levels comes at 0.632, expected to provide resistance. Similarly, the daily 61.8% fib level is at 0.6278, expected to provide resistance.
It was not a good start to the week for the New Zealand currency, as it weakened sharply against its American rival. NZD/USD fell to 0.6913 on Monday and trades at around 0.6220 ahead of Tuesday’s opening. The Kiwi lost the most during European trading hours despite financial markets in the Old Continent remaining closed due to the Easter Monday Holiday.
The main market driver at the beginning of the week was the Japanese yen, which edged lower following comments from the new Bank of Japan Governor, Kazuo Ueda, replacing Haruhiko Kuroda.
Among other things, Ueda said that he has agreed with Prime Minister Fumio Kishida that there is no immediate need to change the 2013 joint statement with the government. Furthermore, he noted that a small rate hike would not be a big issue for the financial system, quite relevant after a decade of ultra-loose monetary tightening in the country.
The US Dollar benefited from JPY’s broad weakness and speculation that most major central banks will soon hit the pause bottom amid the increased risk of a global recession. Central banks had started retrieving monetary support in 2022 to tame inflation, and most of them stand halfway towards their goals. Still, continued tightening has resulted in a banking crisis, while growth has turned sluggish.
NZD/USD daily chart offers a neutral stance, although the risk of a bearish continuation has increased. It trades between directionless moving averages, with the 100 SMA providing resistance around 0.6300 and the 200 SMA acting as dynamic support at 0.6160. At the same time, the pair seesaws around an also flat 20 SMA, aiming to end the day below it. Finally, technical indicators hover around their midlines with uneven downward strength, in line with another leg south.
Technical Levels: Supports and Resistances
NZDUSD currently trading at 0.6215 at the time of writing. Pair opened at 0.6268 and is trading with a change of -0.85 % .
| Overview | Overview.1 | |
|---|---|---|
| 0 | Today last price | 0.6215 |
| 1 | Today Daily Change | -0.0053 |
| 2 | Today Daily Change % | -0.8500 |
| 3 | Today daily open | 0.6268 |
The pair is trading below its 20 Daily moving average @ 0.6243, below its 50 Daily moving average @ 0.6259 , below its 100 Daily moving average @ 0.6302 and above its 200 Daily moving average @ 0.616
| Trends | Trends.1 | |
|---|---|---|
| 0 | Daily SMA20 | 0.6243 |
| 1 | Daily SMA50 | 0.6259 |
| 2 | Daily SMA100 | 0.6302 |
| 3 | Daily SMA200 | 0.6160 |
The previous day high was 0.6389 while the previous day low was 0.6209. The daily 38.2% Fib levels comes at 0.632, expected to provide resistance. Similarly, the daily 61.8% fib level is at 0.6278, expected to provide resistance.
Note the levels of interest below:
- Pivot support is noted at 0.6188, 0.6108, 0.6008
- Pivot resistance is noted at 0.6369, 0.6469, 0.6549
| Levels | Levels.1 |
|---|---|
| Previous Daily High | 0.6389 |
| Previous Daily Low | 0.6209 |
| Previous Weekly High | 0.6389 |
| Previous Weekly Low | 0.6207 |
| Previous Monthly High | 0.6298 |
| Previous Monthly Low | 0.6084 |
| Daily Fibonacci 38.2% | 0.6320 |
| Daily Fibonacci 61.8% | 0.6278 |
| Daily Pivot Point S1 | 0.6188 |
| Daily Pivot Point S2 | 0.6108 |
| Daily Pivot Point S3 | 0.6008 |
| Daily Pivot Point R1 | 0.6369 |
| Daily Pivot Point R2 | 0.6469 |
| Daily Pivot Point R3 | 0.6549 |
[/s2If]
Join Our Telegram Group


