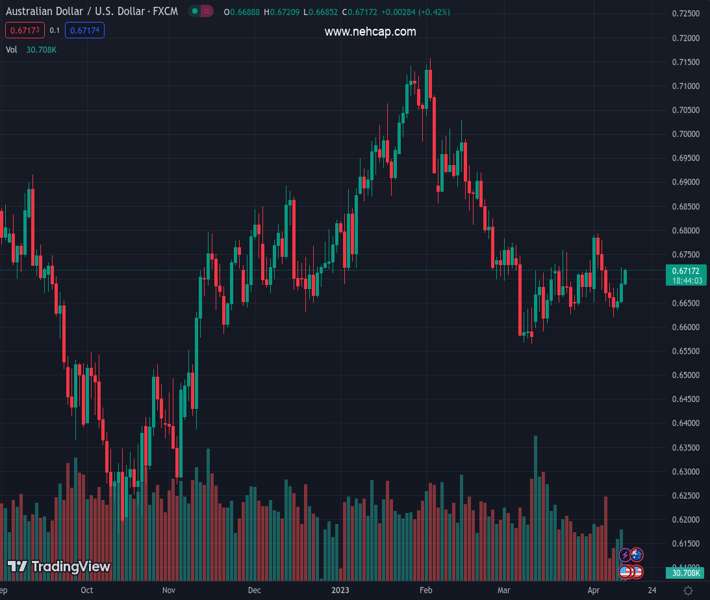
#AUDUSD @ 0.66398 The United States monthly employment report revived growth concerns. (Pivot Orderbook analysis)
…
This is a premium post.
[s2If !current_user_can(access_s2member_level4)]Please register for PREMIUM VERSION HERE to read full post below containing analysis. In case of any error or you think you are not able to read the full post below, please email us at support#nehcap.com [lwa][/s2If] [s2If current_user_can(access_s2member_level4)]
- The United States monthly employment report revived growth concerns.
- Australia will return from a long weekend publishing Westpac Consumer Confidence.
- AUD/USD declines for a fifth consecutive day near the 0.6600 figure.
The pair currently trades last at 0.66398.
The previous day high was 0.6691 while the previous day low was 0.6641. The daily 38.2% Fib levels comes at 0.6672, expected to provide resistance. Similarly, the daily 61.8% fib level is at 0.666, expected to provide resistance.
The AUD/USD pair extended its intraday slump to 0.6618 after Wall Street’s opening, barely bouncing from the level and currently trading in the 0.6680 price zone. The pair fell alongside US indexes, which started the day on the wrong foot amid concerns about a potential recession in the United States.
The Nonfarm Payrolls (NFP) report released on Friday showed that the US added 236,000 new jobs in March, slightly lower than the market expectation of 240,000. In addition, the Unemployment Rate edged lower to 3.5% from 3.6% in the same period, while the Labor Force Participation Rate improved to 62.6% from 62.5%. Finally, annual wage inflation, as measured by the Average Hourly Earnings, declined to 4.2% from 4.6%.
The US Dollar surged following the news as it indicated the job sector remains resilient while inflation keeps easing at a slow pace. Indeed, the NFP report was insufficient to change the Federal Reserve’s (Fed) newly adopted dovish stance. The central bank is expected to hike its benchmark rate by 25 bps in April and pause afterwards. The banking crisis that started with the collapse of two American regional banks accelerated the Fed’s decision to put an end to the tightening cycle.
Australia will return from a long weekend after the Easter holidays and will publish early on Tuesday, April. Westpac Consumer Confidence foreseen at 0.8% after posting 0% in March.
The AUD/USD pair is down for a fifth consecutive day and poised to extend its slump, according to technical readings in the daily chart, as the pair develops below directionless moving averages. The 20 Simple Moving Average (SMA) provides dynamic resistance just above the daily high, at 0.6685. Technical indicators, in the meantime, stand below their midlines without enough directional strength to confirm a steeper extension coming up next. A break through the 0.6600 level should encourage sellers and push AUD/USD towards the 0.6530/40 support area.
Technical Levels: Supports and Resistances
AUDUSD currently trading at 0.6639 at the time of writing. Pair opened at 0.6674 and is trading with a change of -0.52 % .
| Overview | Overview.1 | |
|---|---|---|
| 0 | Today last price | 0.6639 |
| 1 | Today Daily Change | -0.0035 |
| 2 | Today Daily Change % | -0.5200 |
| 3 | Today daily open | 0.6674 |
The pair remains strongly bearish on the daily time frame. It trades below the 20 SMA @ 0.6688, 50 SMA 0.6784, 100 SMA @ 0.68 and 200 SMA @ 0.6748.
| Trends | Trends.1 | |
|---|---|---|
| 0 | Daily SMA20 | 0.6688 |
| 1 | Daily SMA50 | 0.6784 |
| 2 | Daily SMA100 | 0.6800 |
| 3 | Daily SMA200 | 0.6748 |
The previous day high was 0.6691 while the previous day low was 0.6641. The daily 38.2% Fib levels comes at 0.6672, expected to provide resistance. Similarly, the daily 61.8% fib level is at 0.666, expected to provide resistance.
Note the levels of interest below:
- Pivot support is noted at 0.6646, 0.6618, 0.6596
- Pivot resistance is noted at 0.6696, 0.6719, 0.6746
| Levels | Levels.1 |
|---|---|
| Previous Daily High | 0.6691 |
| Previous Daily Low | 0.6641 |
| Previous Weekly High | 0.6793 |
| Previous Weekly Low | 0.6641 |
| Previous Monthly High | 0.6784 |
| Previous Monthly Low | 0.6564 |
| Daily Fibonacci 38.2% | 0.6672 |
| Daily Fibonacci 61.8% | 0.6660 |
| Daily Pivot Point S1 | 0.6646 |
| Daily Pivot Point S2 | 0.6618 |
| Daily Pivot Point S3 | 0.6596 |
| Daily Pivot Point R1 | 0.6696 |
| Daily Pivot Point R2 | 0.6719 |
| Daily Pivot Point R3 | 0.6746 |
[/s2If]
Join Our Telegram Group


